RF cat corner
Export QGIS maps and terrain height data to Forsk Atoll.
09 Oct 2023Forsk Atoll antenna planning software is not so hard to use when a suitable map and terrain height data is available for import into Atoll. However such ready to use data is rather hard to find and finding such data is the top question asked in the comments of most Atoll tutorials.
Here is a tutorial to make a pretty convenient map with QGIS, usefull for all needs besides just Atoll, and to export relevant data towards Atoll.
QGIS
Installation
Install QGIS uing the OSGeo4W bundle. Ensure the following is checked for install:
- QGIS
- matplotlib
- numpy
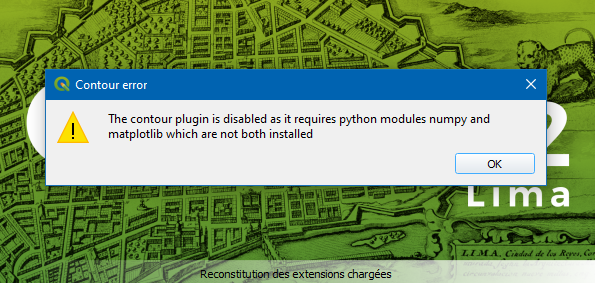
If you see the following or similar error message, check the installed packages in OSGeo4W.
Map and height map preparation
The steps of this part are long, but thanksfully must be done only once and can be reused for several projects. A starting file is given here: QGIS-base.qgz. When using this file, skip straight until Bookmark needed area.
Coordinate reference system
Project -> New (Ctrl + N)
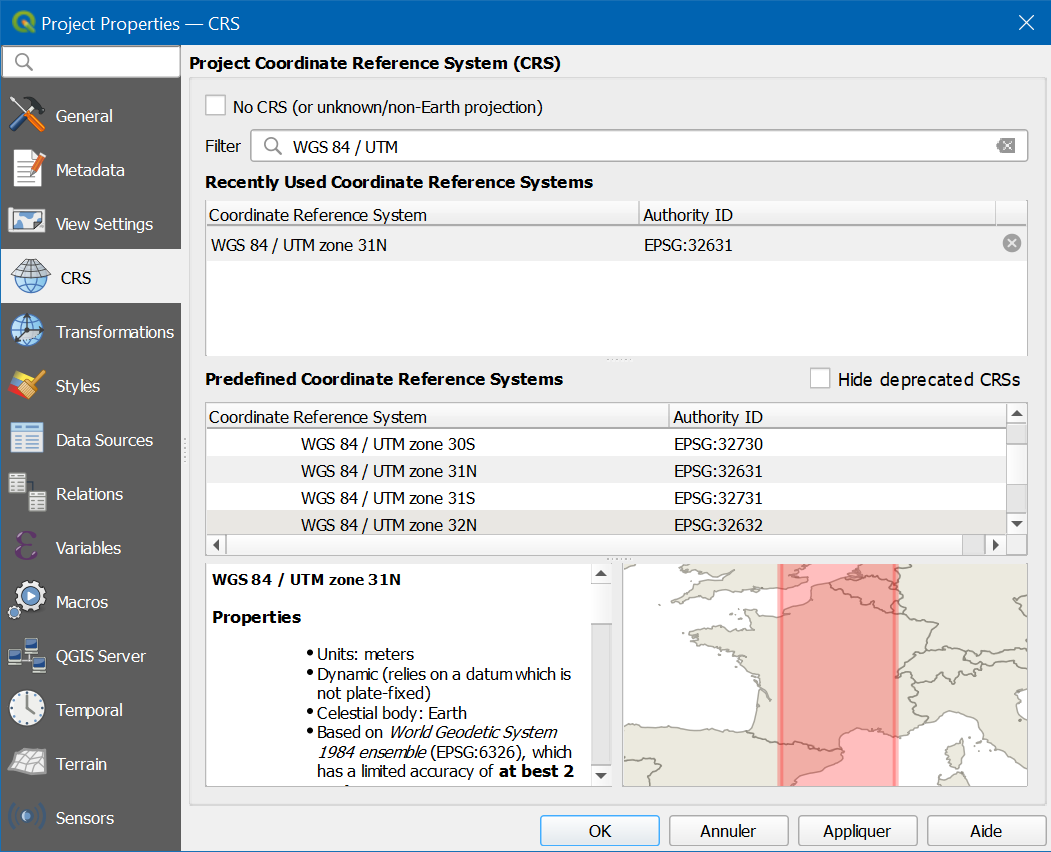
Project -> Properties
Select the WGS 84 / UTM zone corresponding to the area of the study. For France, its UTM 31N (EPSG 32631). Antenna coverage studies are usually on a scale sufficiently small to make UTM practical, and the distances coordinates makes life much easier when estimating distances, for instance for antenna simulation radius settings.
OpenStreetMaps and transparency
By default, the OpenStreetMaps vector layers are opaque. Configuration is needed in order to make it transparent to overlay it on satellite imagery.
Short way
Import this layer file with all the settings: openstreetmap-vector-overlay.qlr and skip next section.
Long way
In case for whatever reason you want to do the previous step manually, here are the instructions. In most case, you ought better import the settings as shown in previous section.
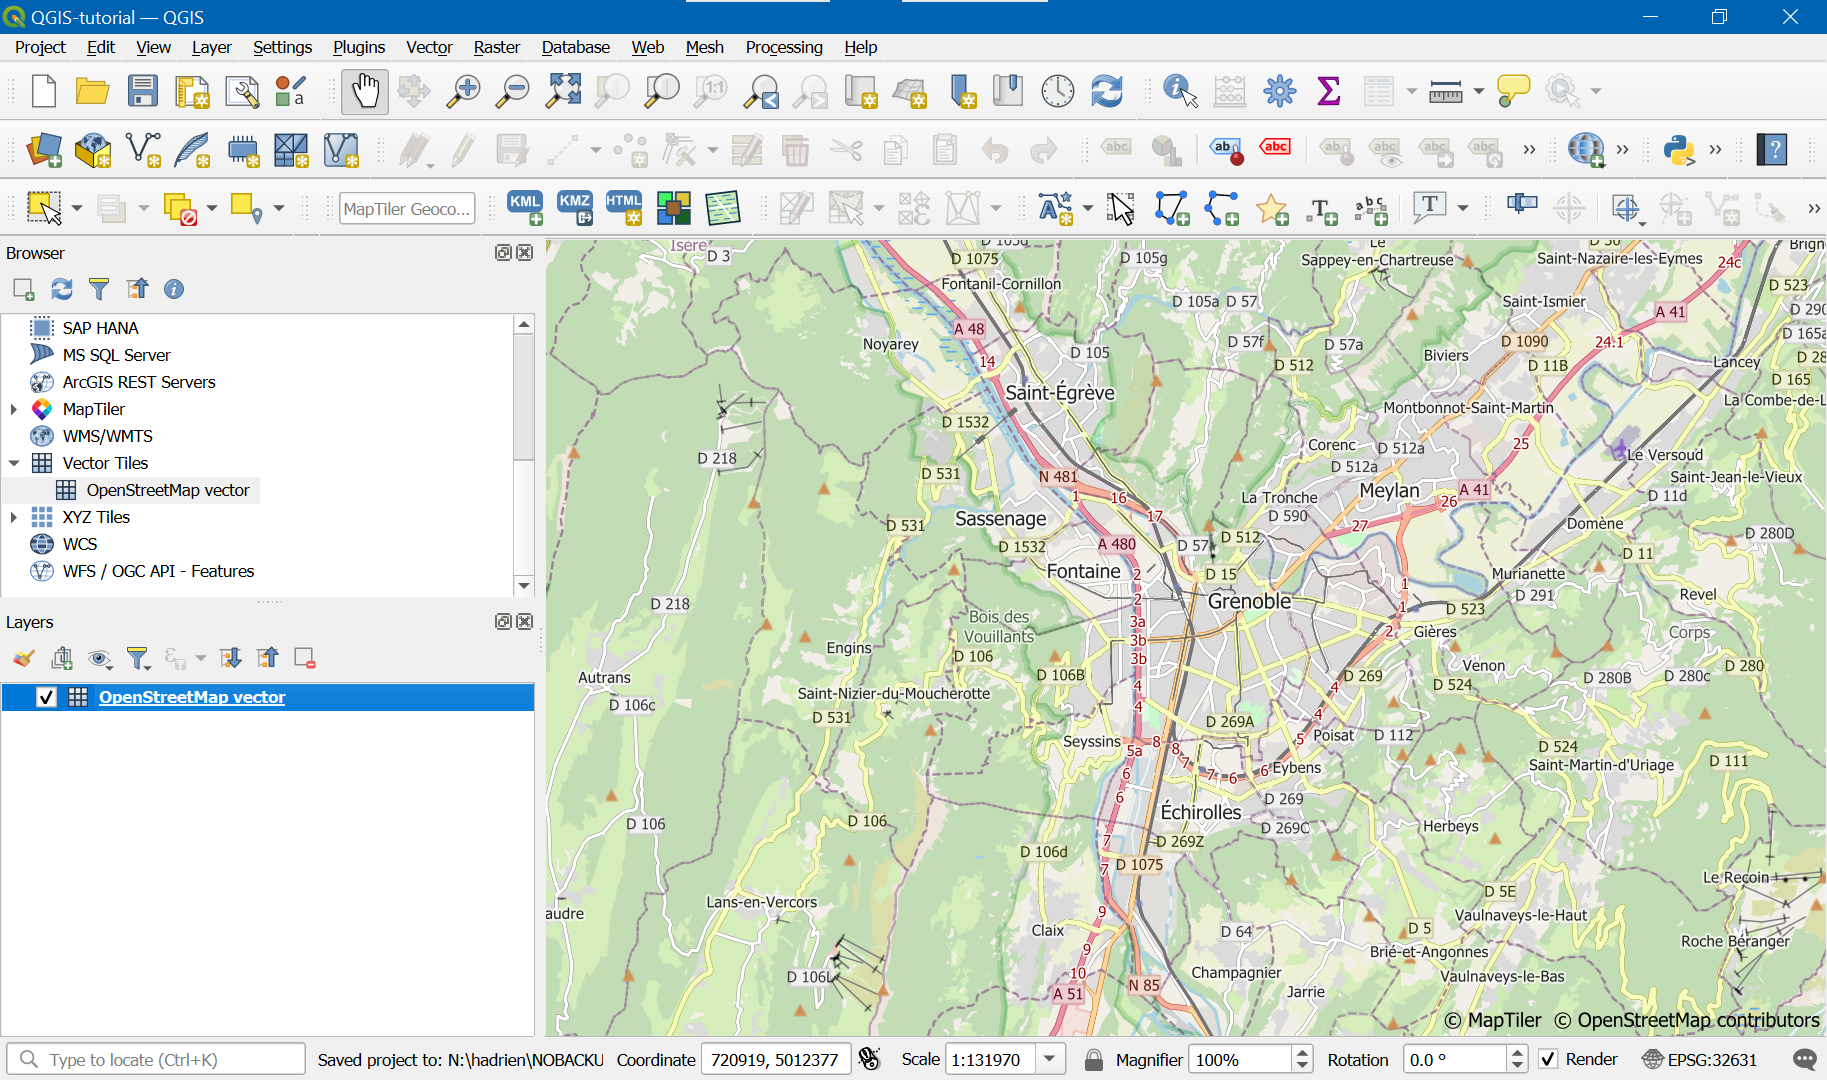
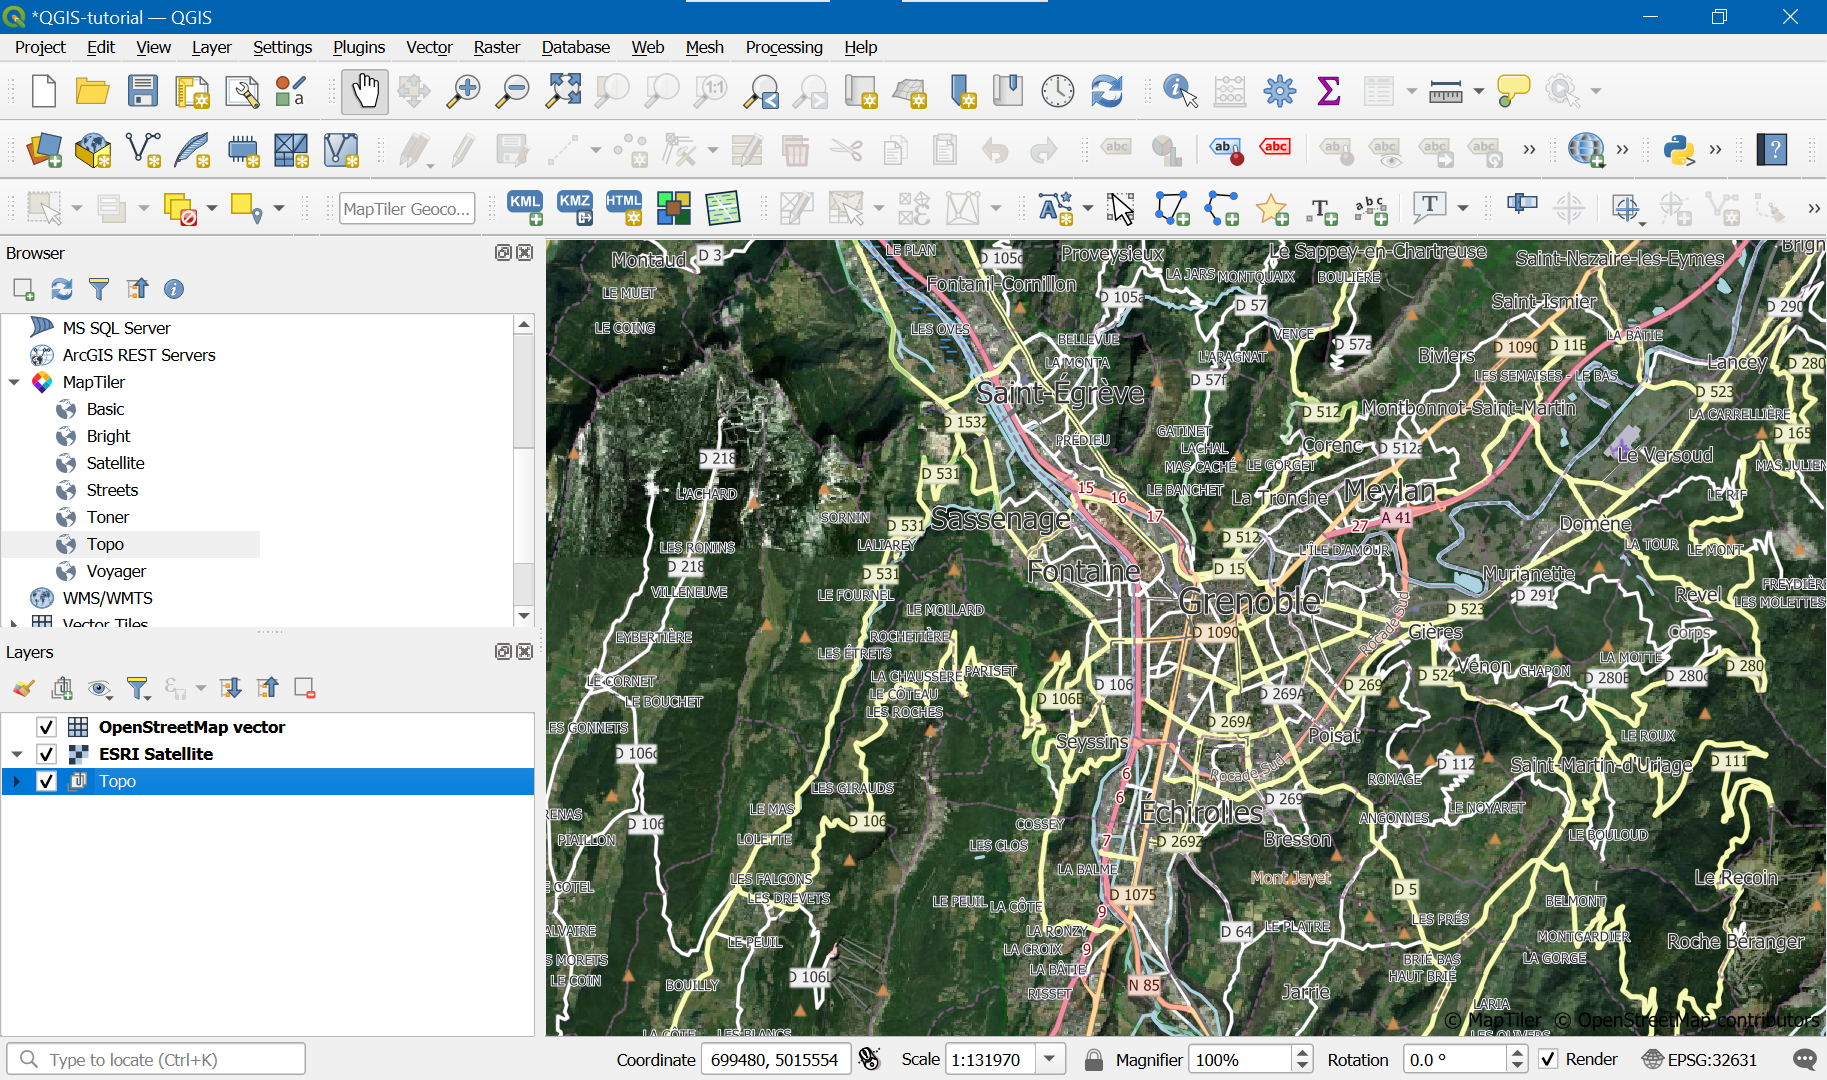
Add OSM map using Vector Tiles -> OpenStreetMap vector:
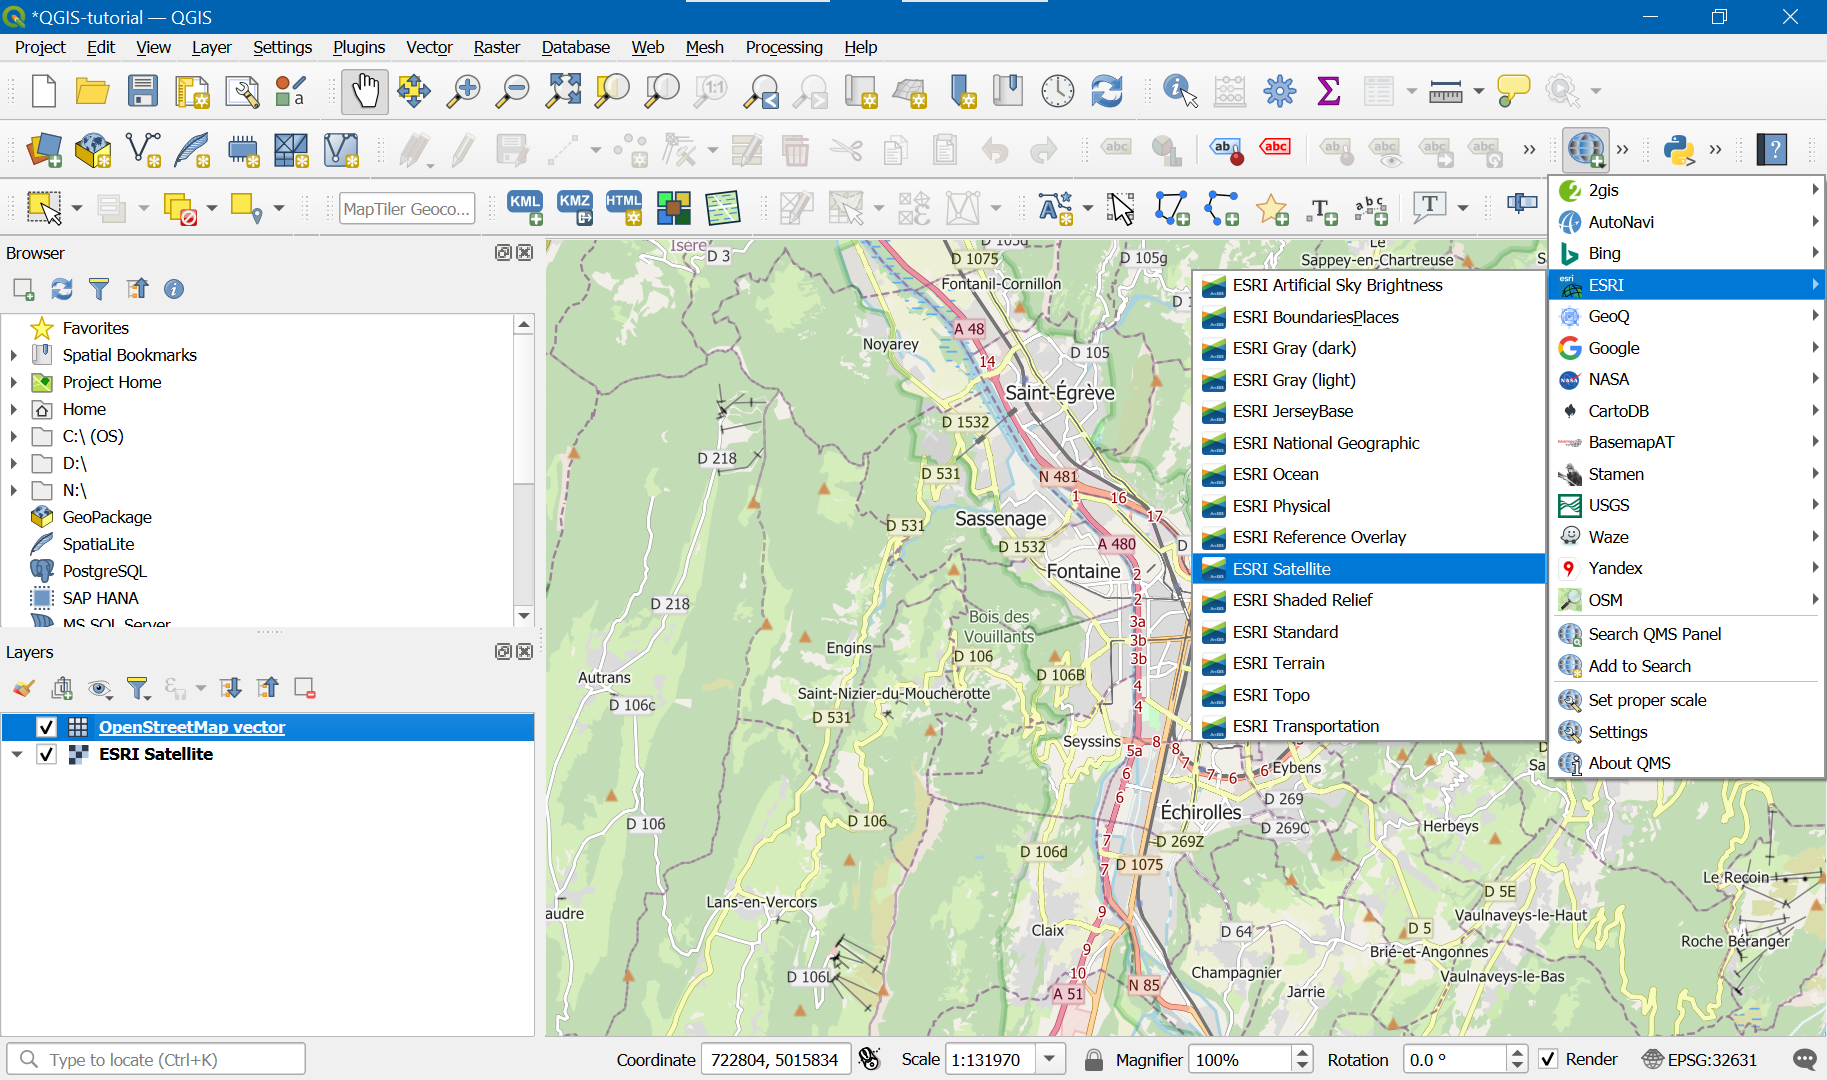
Using QuickMapServices plugin, add satellite picture using QuickMap Services -> ESRI -> ESRI Satellite. The satellite view is not immediately visible because the layer is added behind the previouly added one:
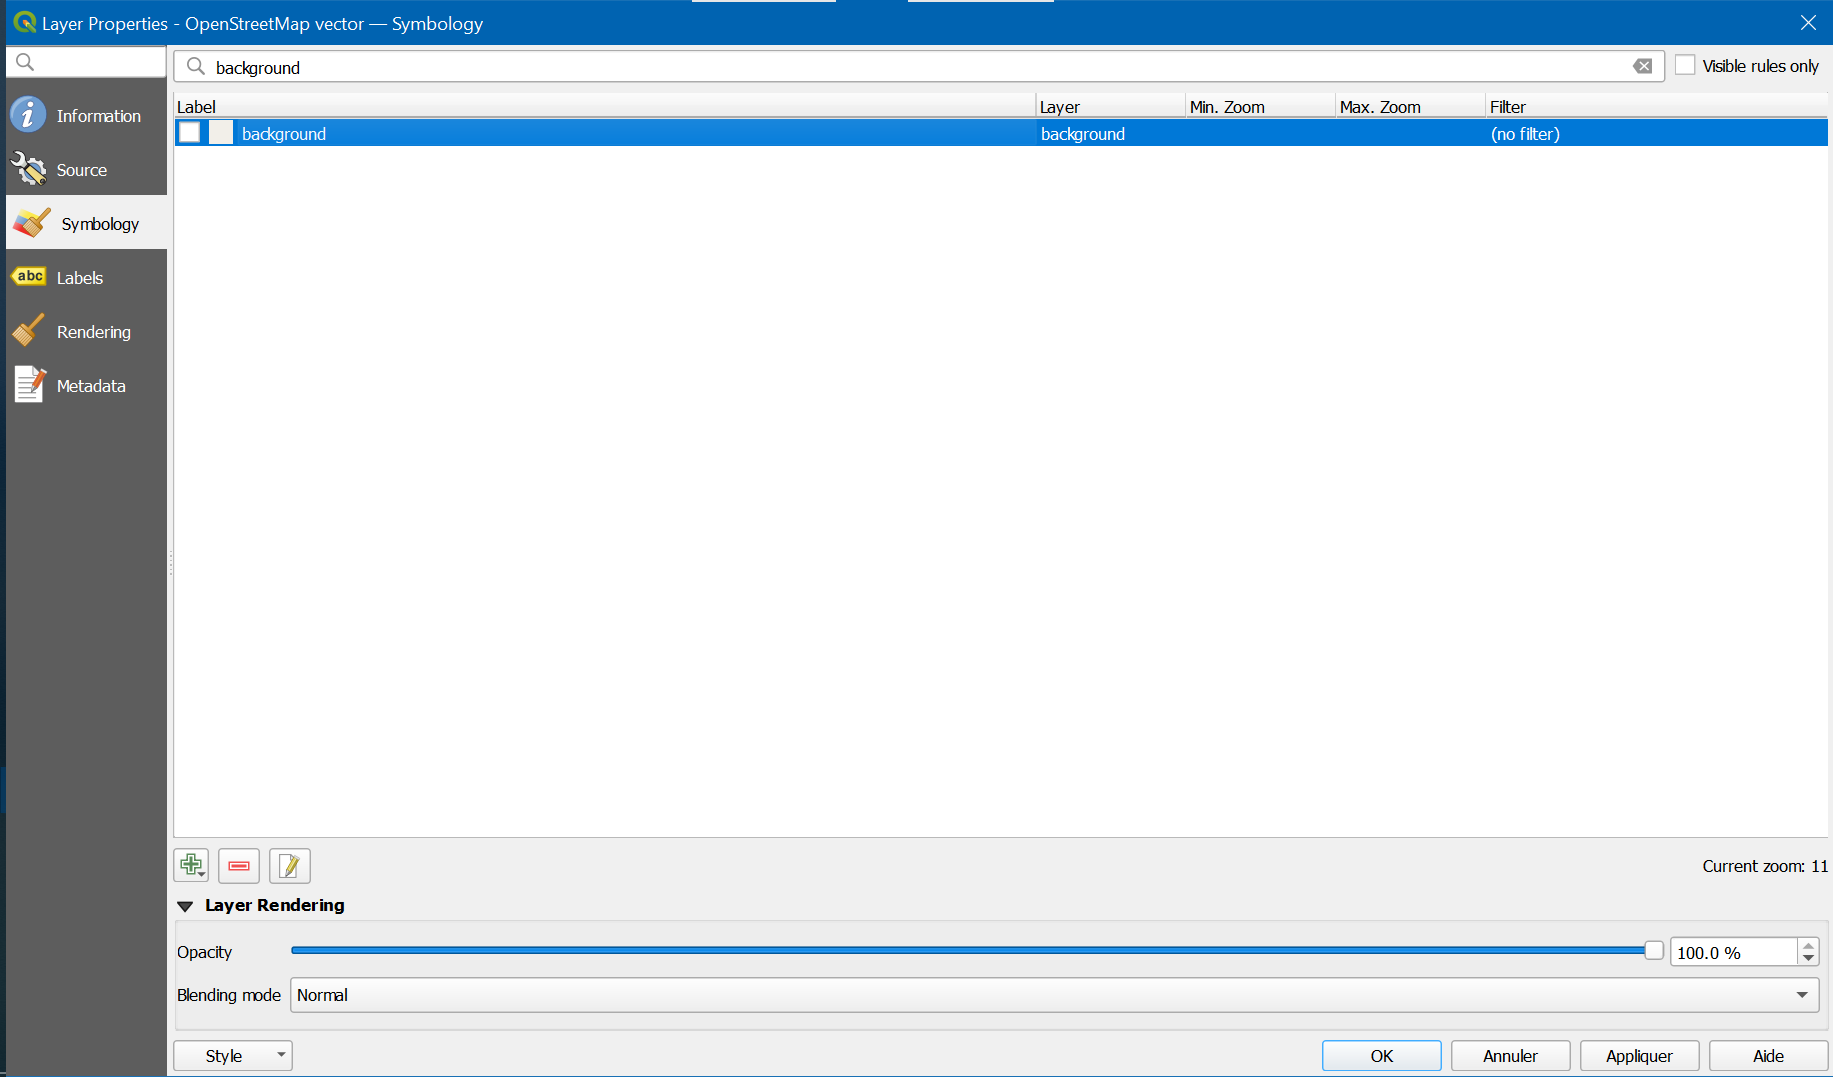
Go to OpenStreetMaps vector properties and :
Uncheck background:
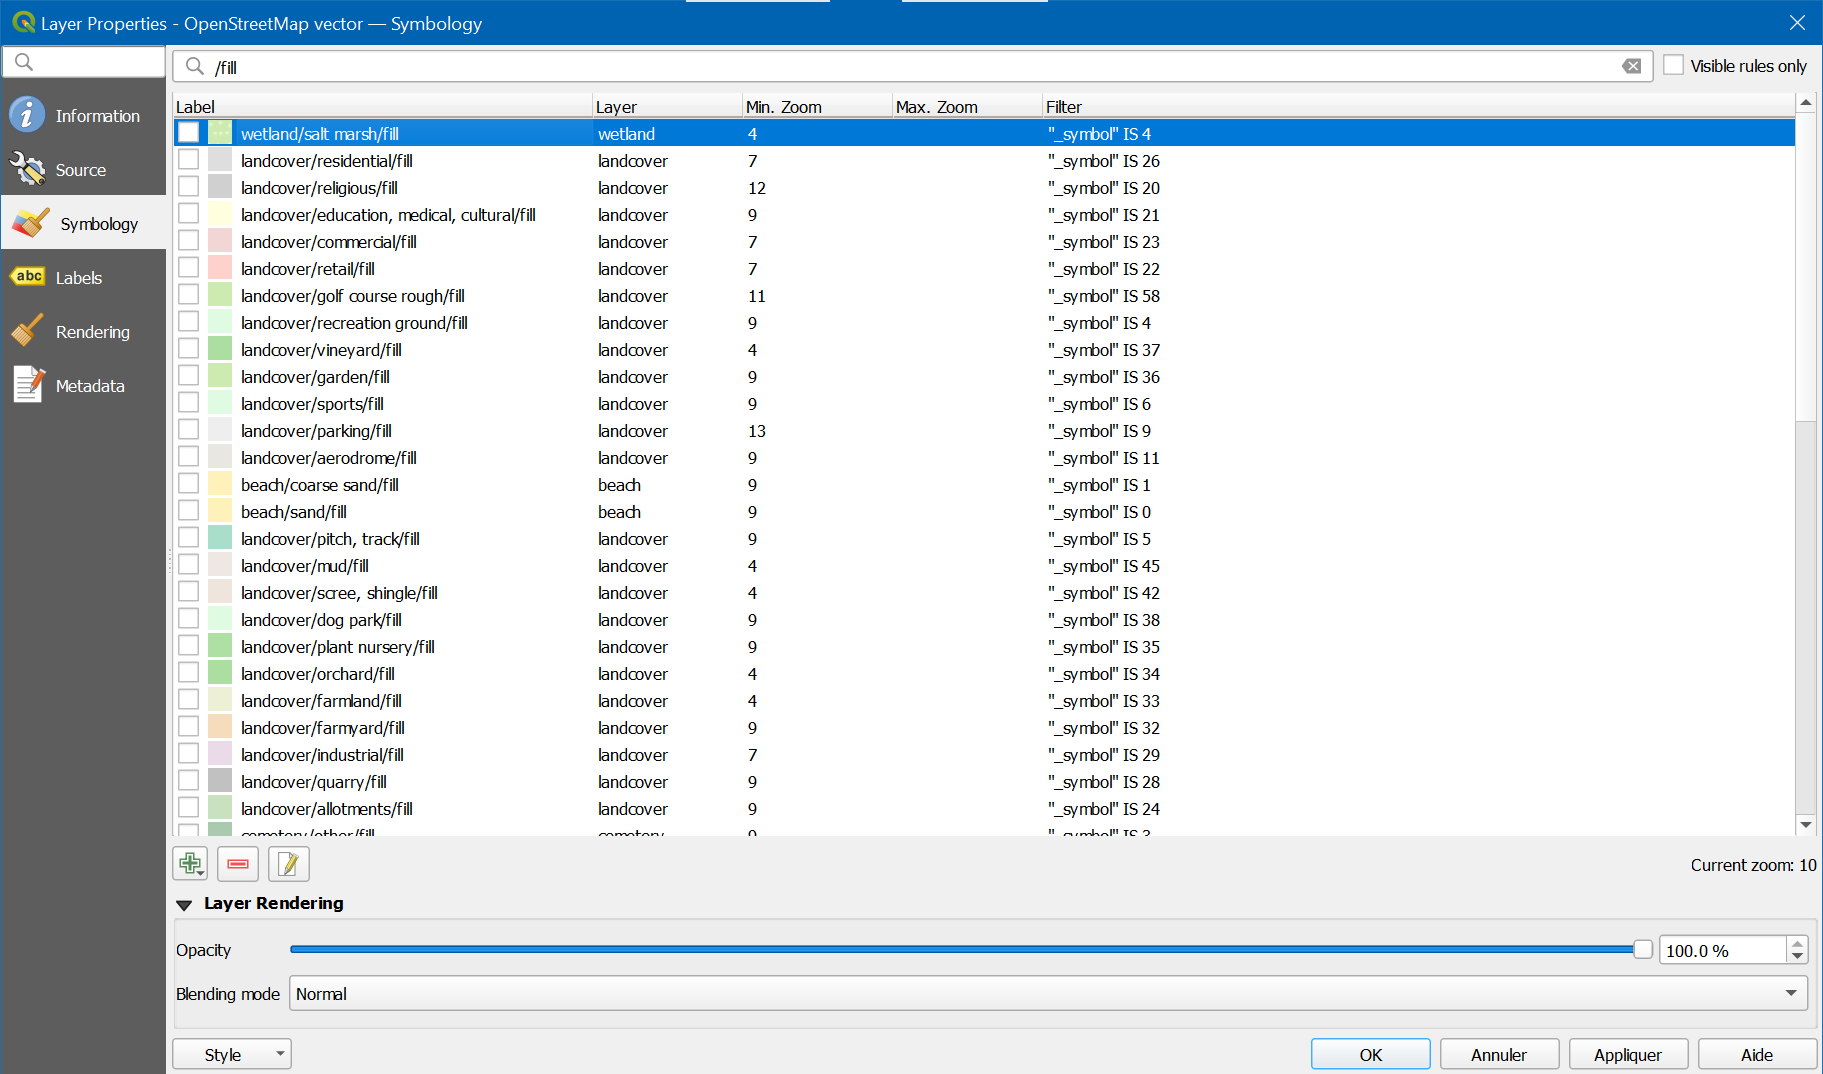
Uncheck fills:
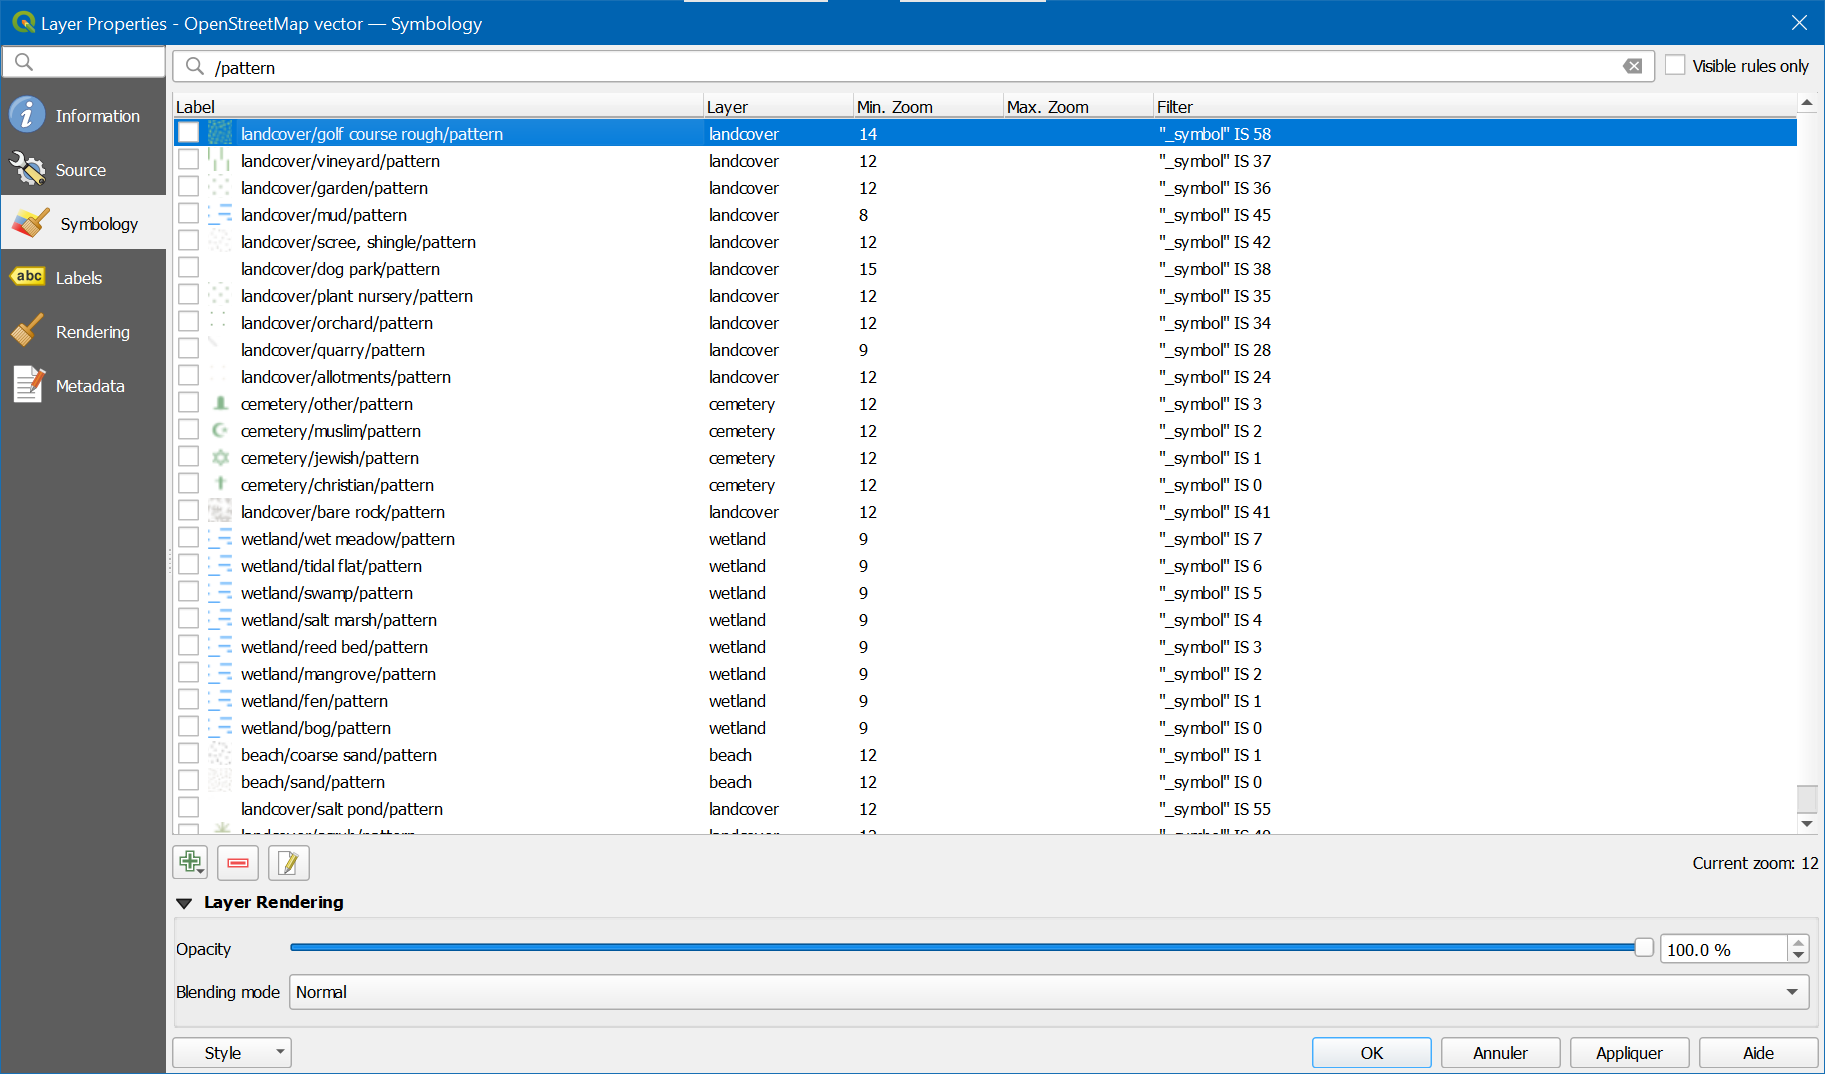
Uncheck patterns:
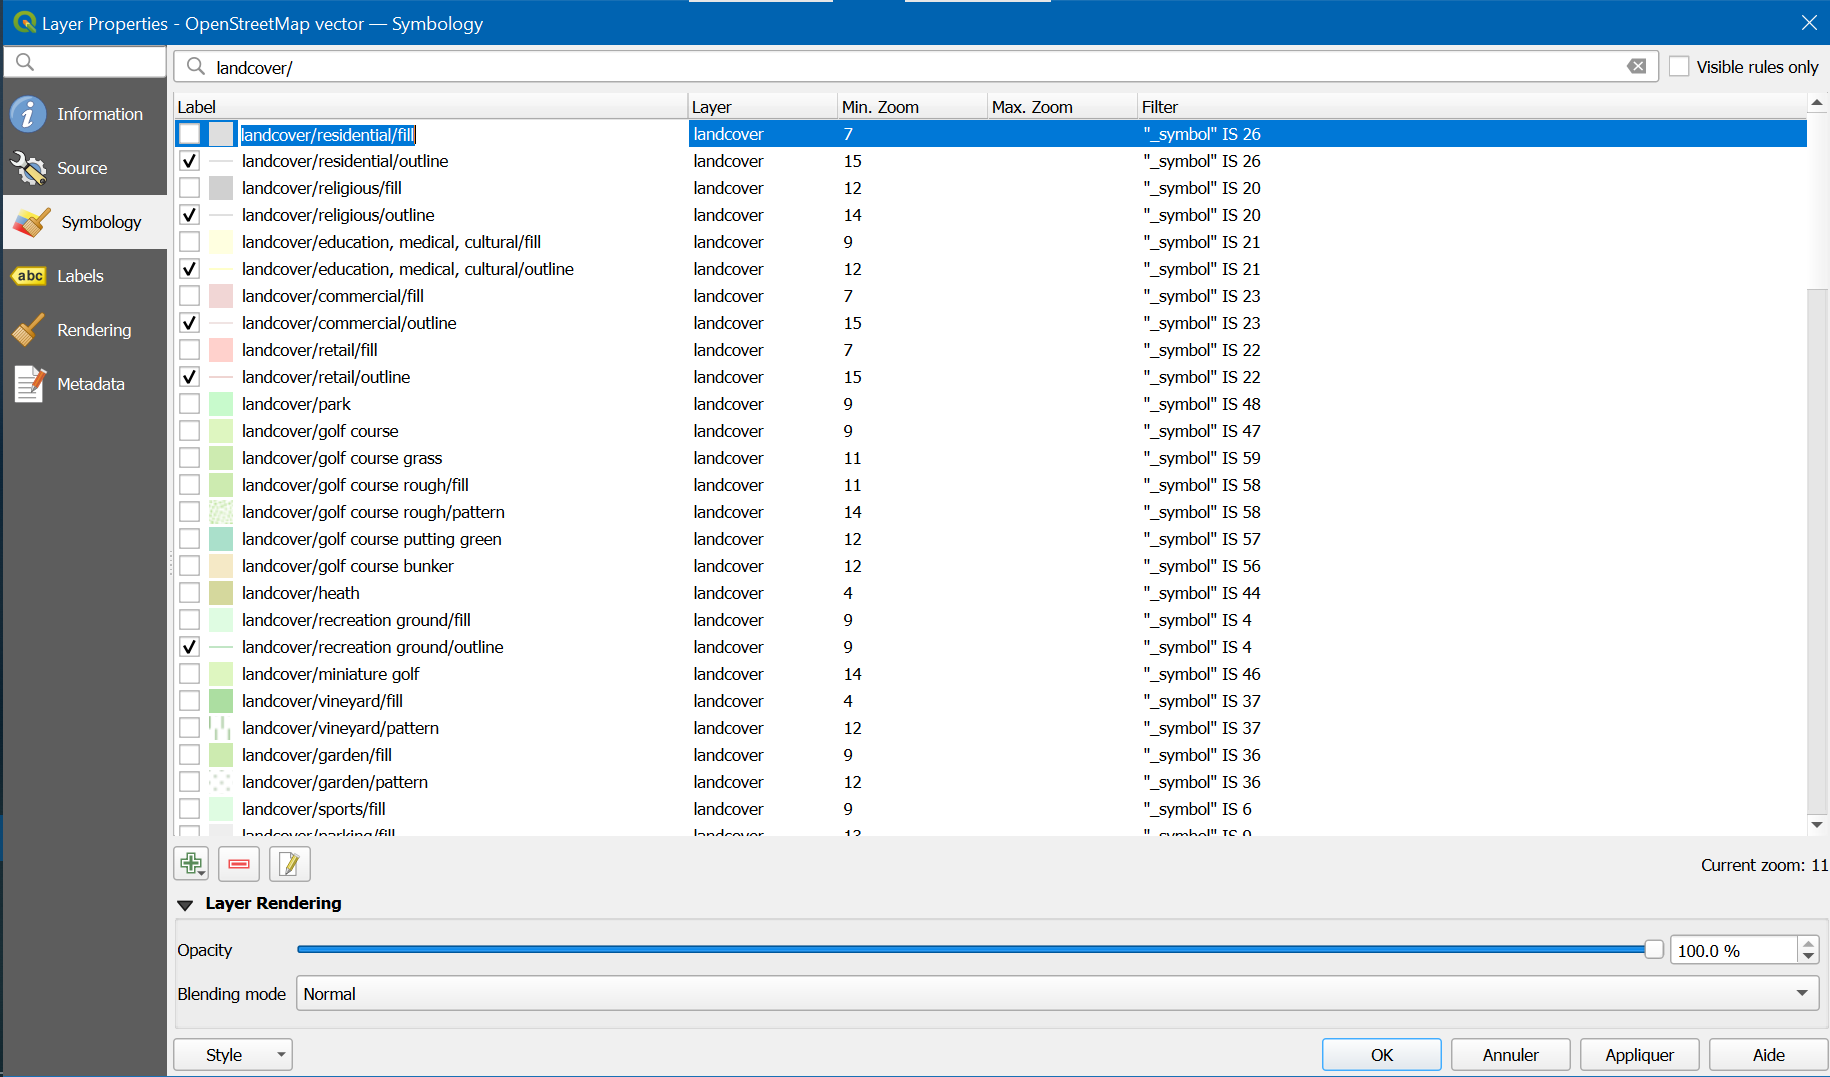
Uncheck landcovers with exception of outlines:
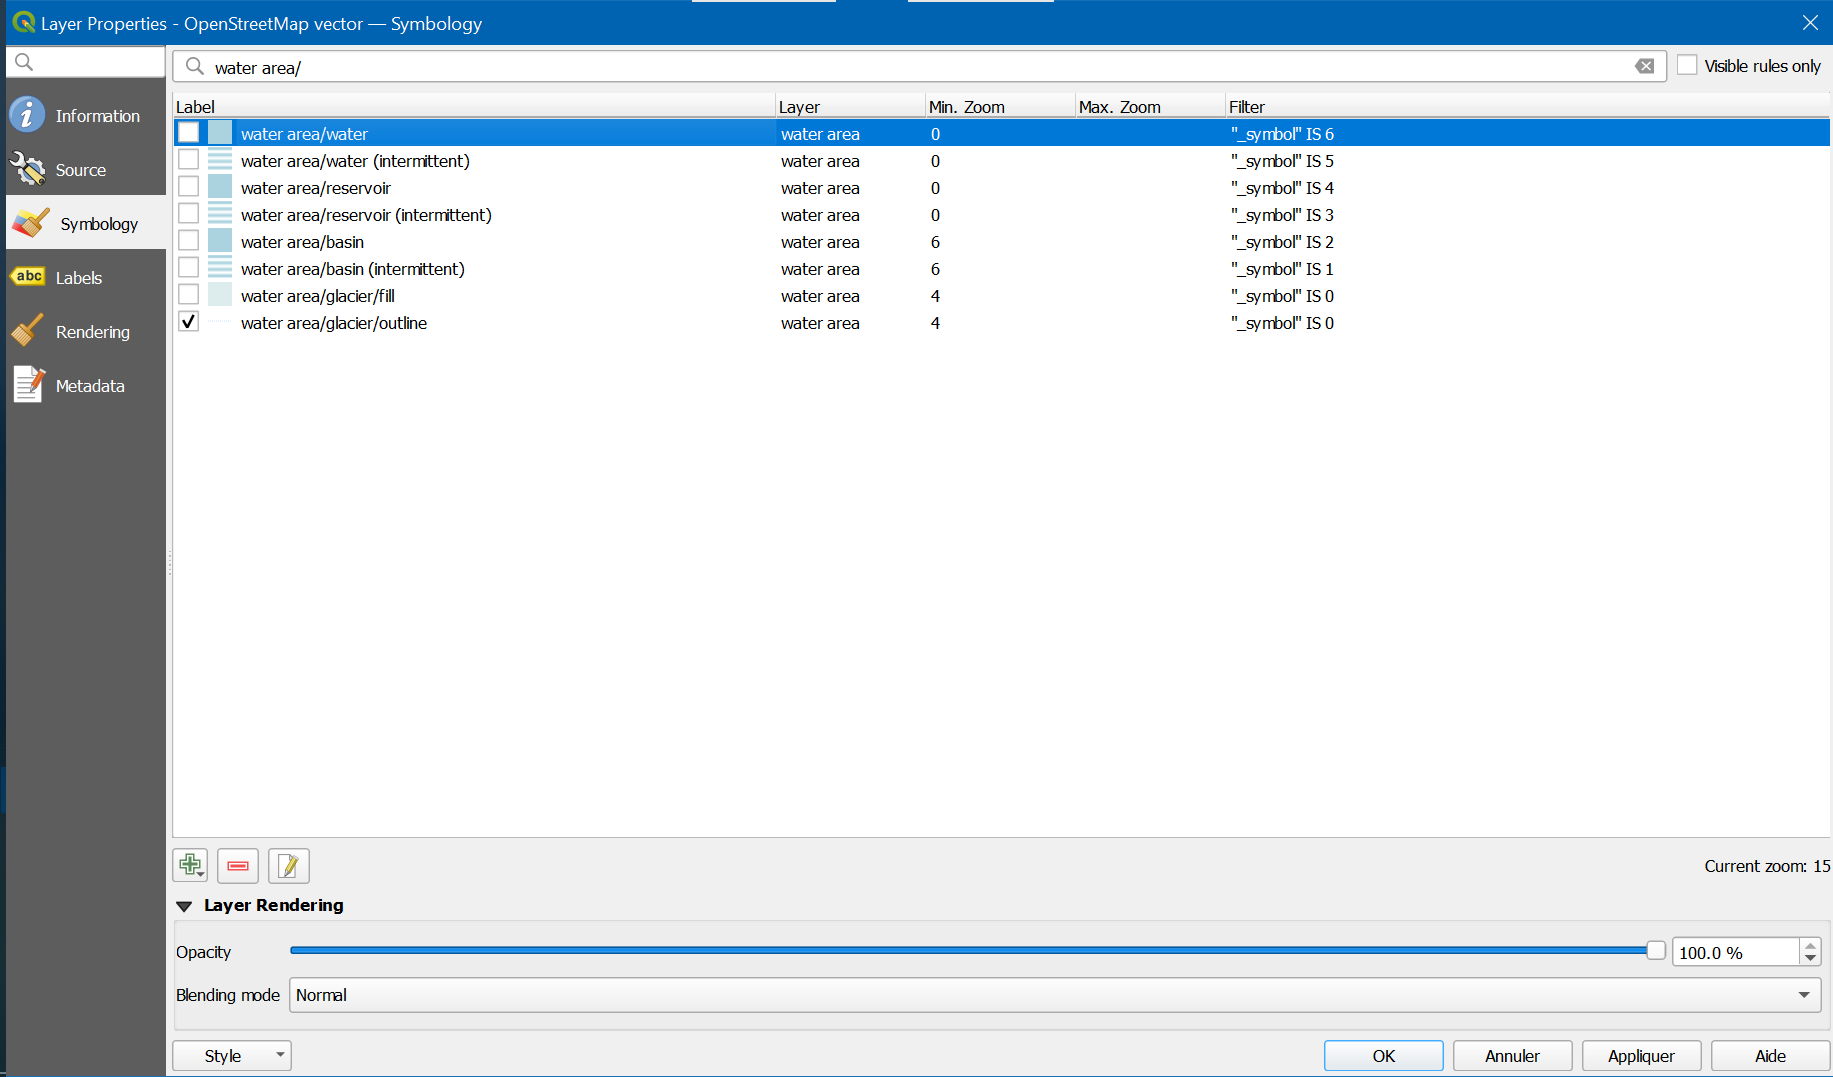
Uncheck water areas with exception of outlines:
Uncheck transportation areas:
![]()
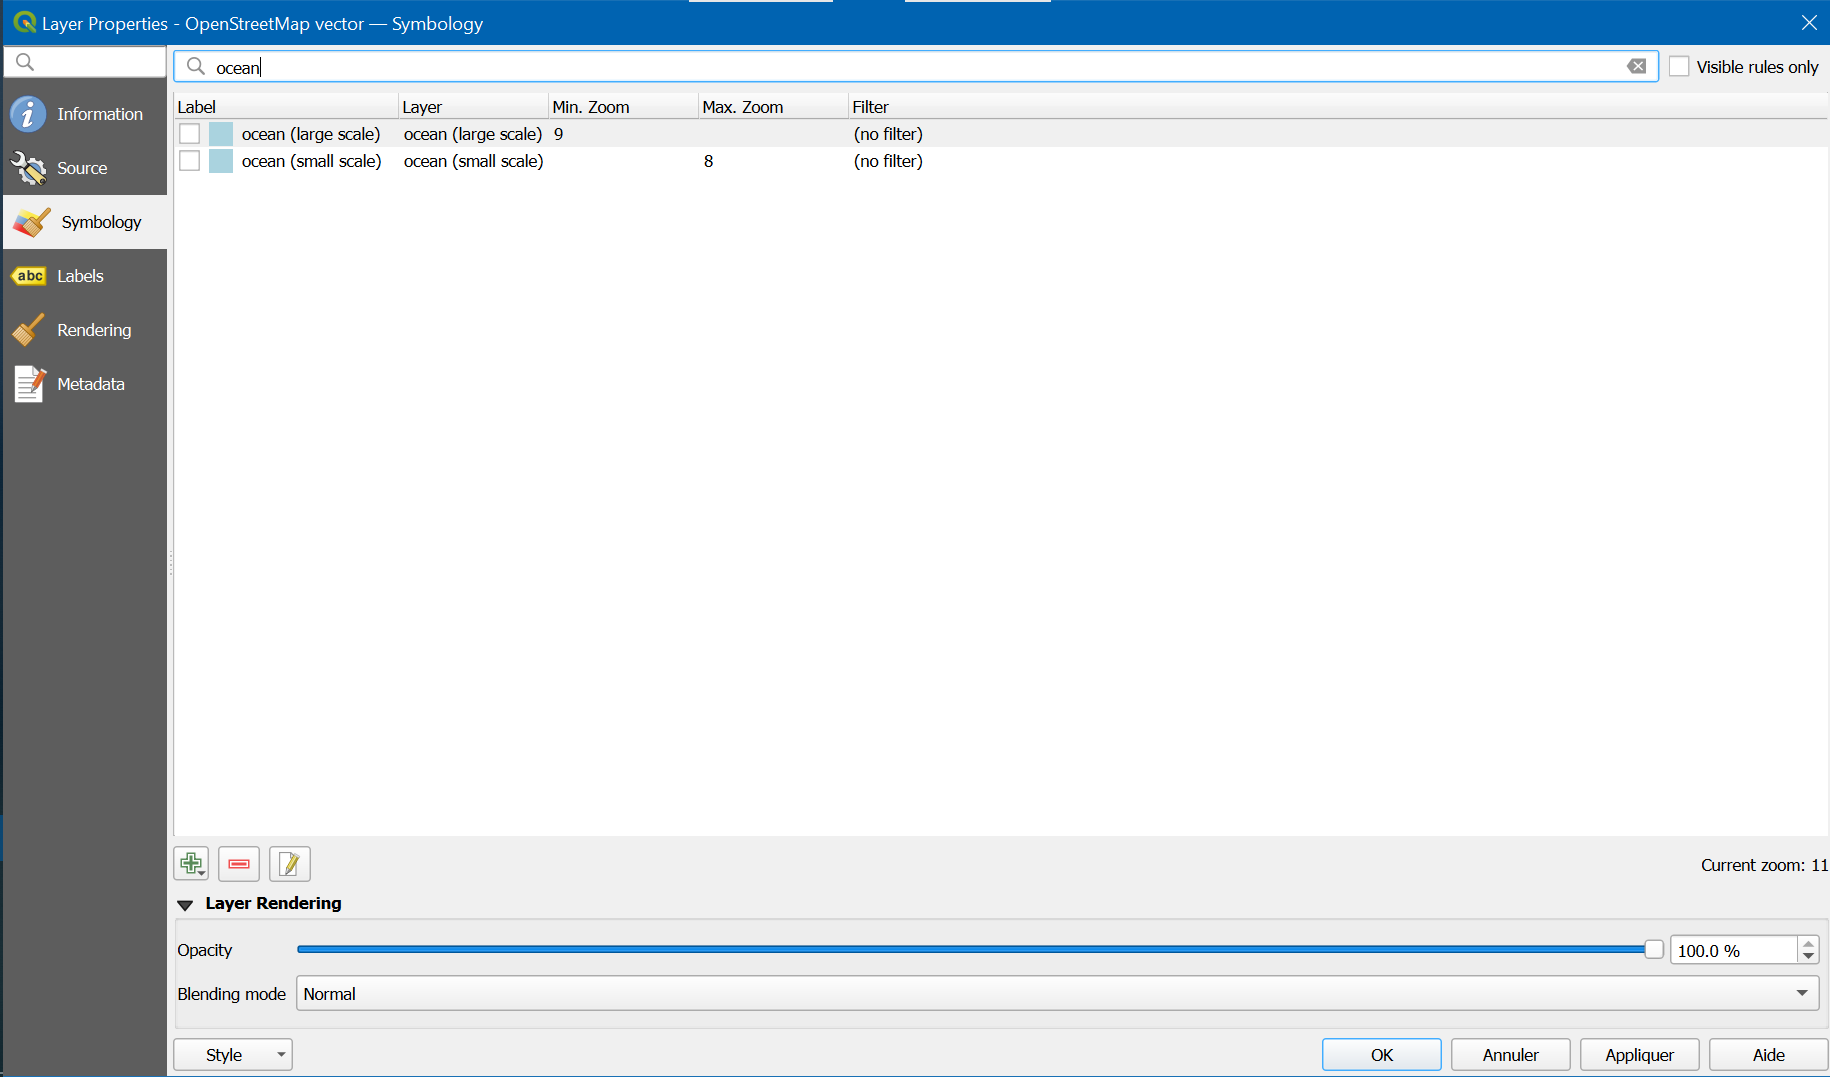
Uncheck oceans:
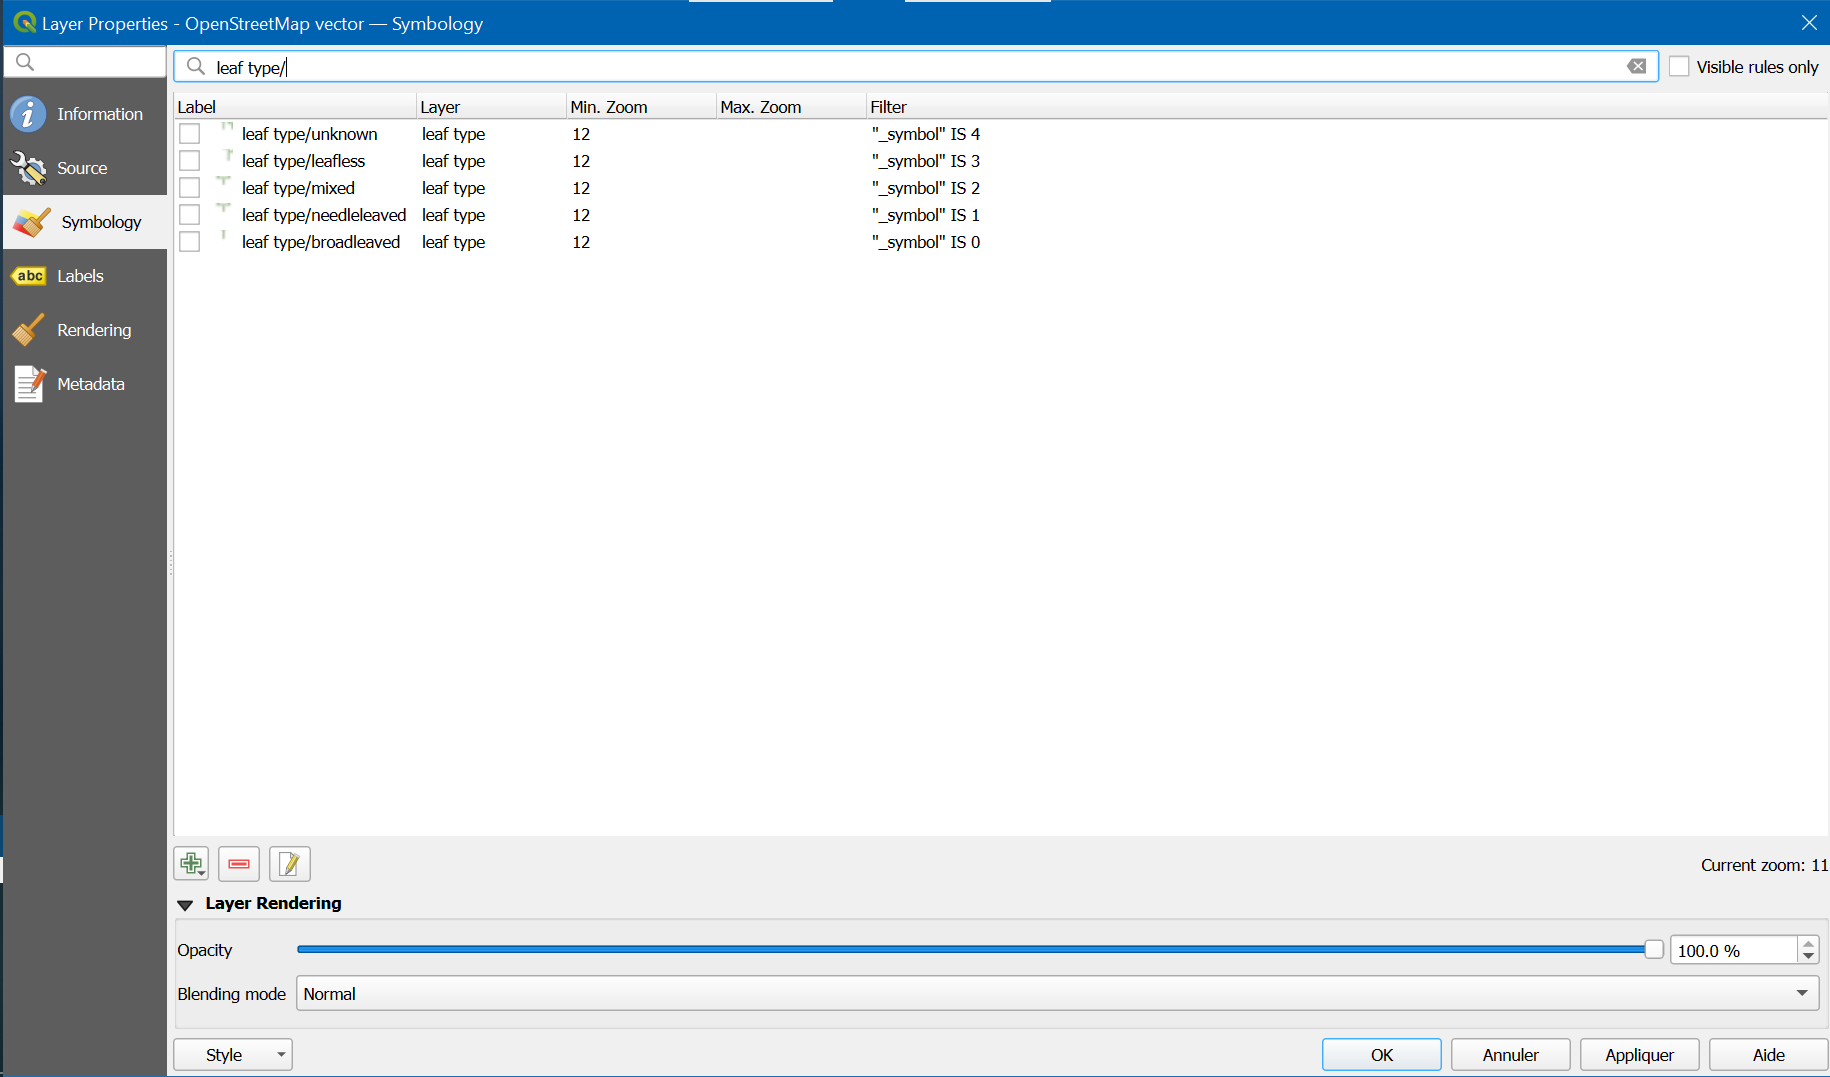
Uncheck leaf types:
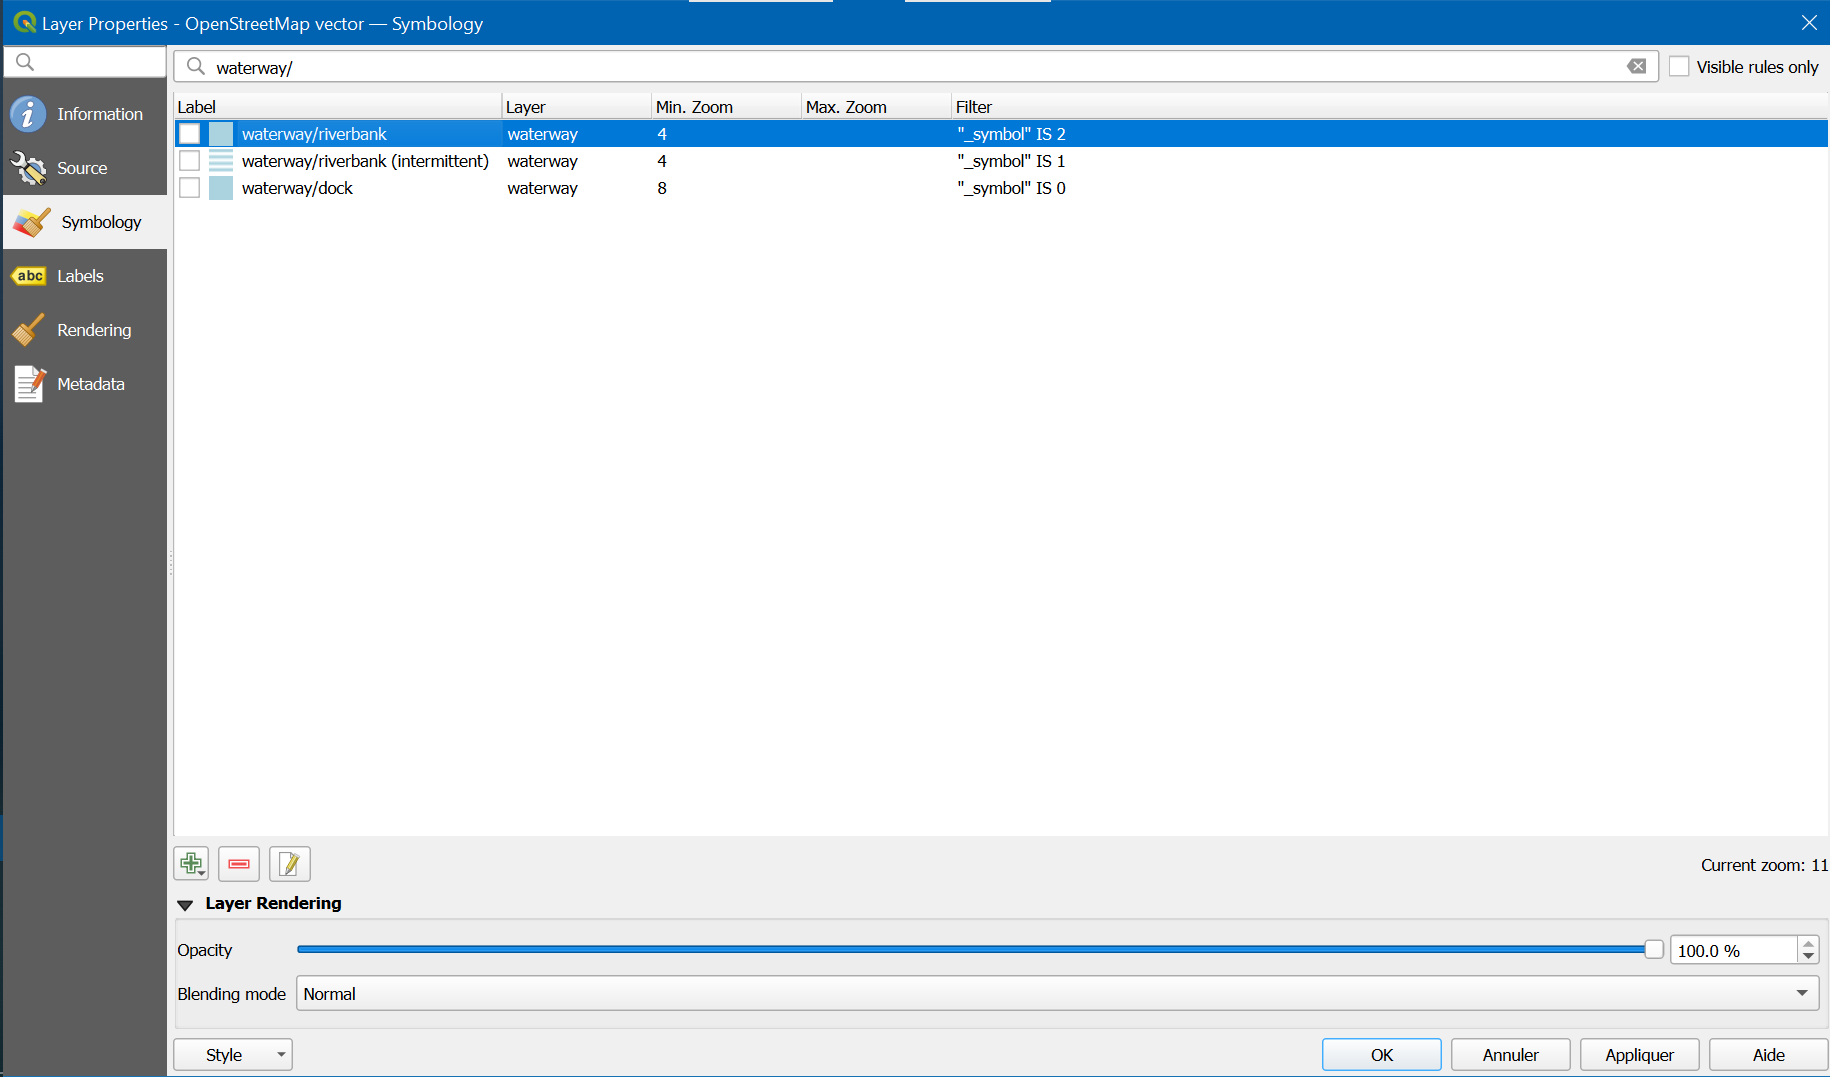
Uncheck waterways :
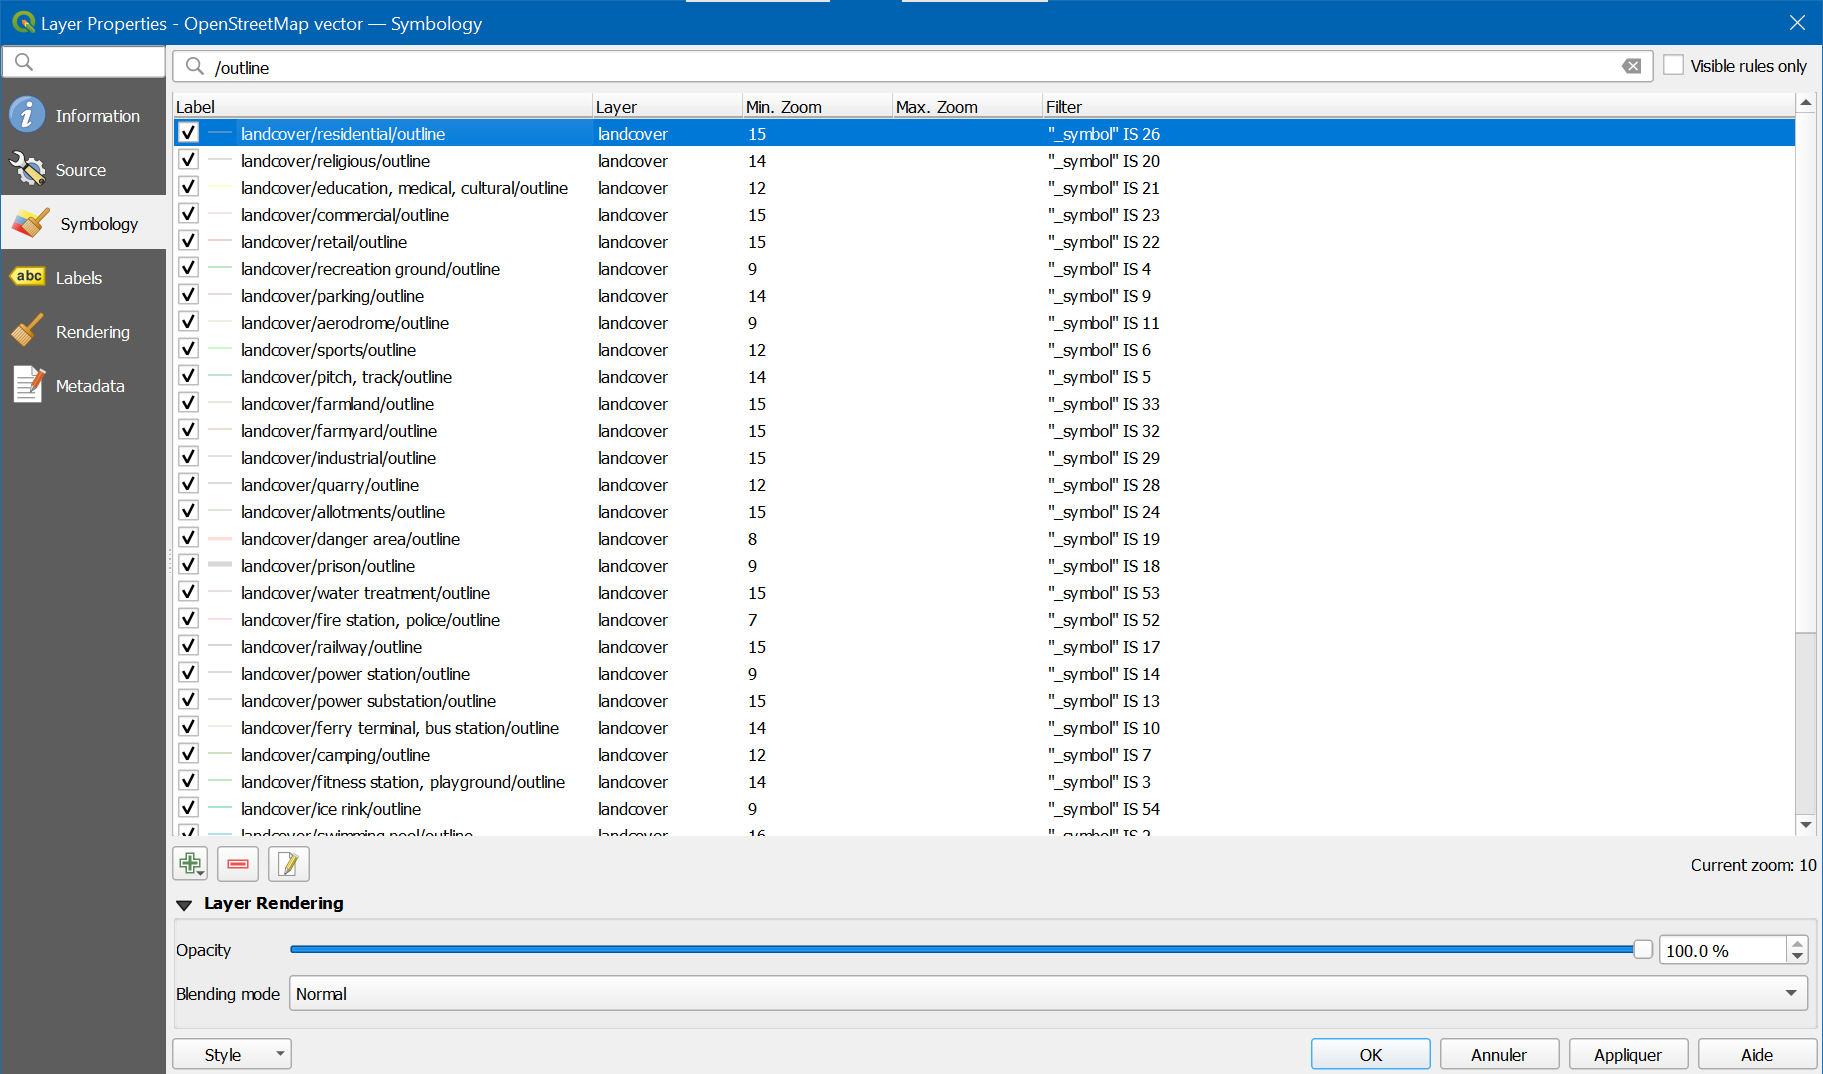
Recheck all outlines in case some outline were accidentally unchecked in previous steps:
Contour maps
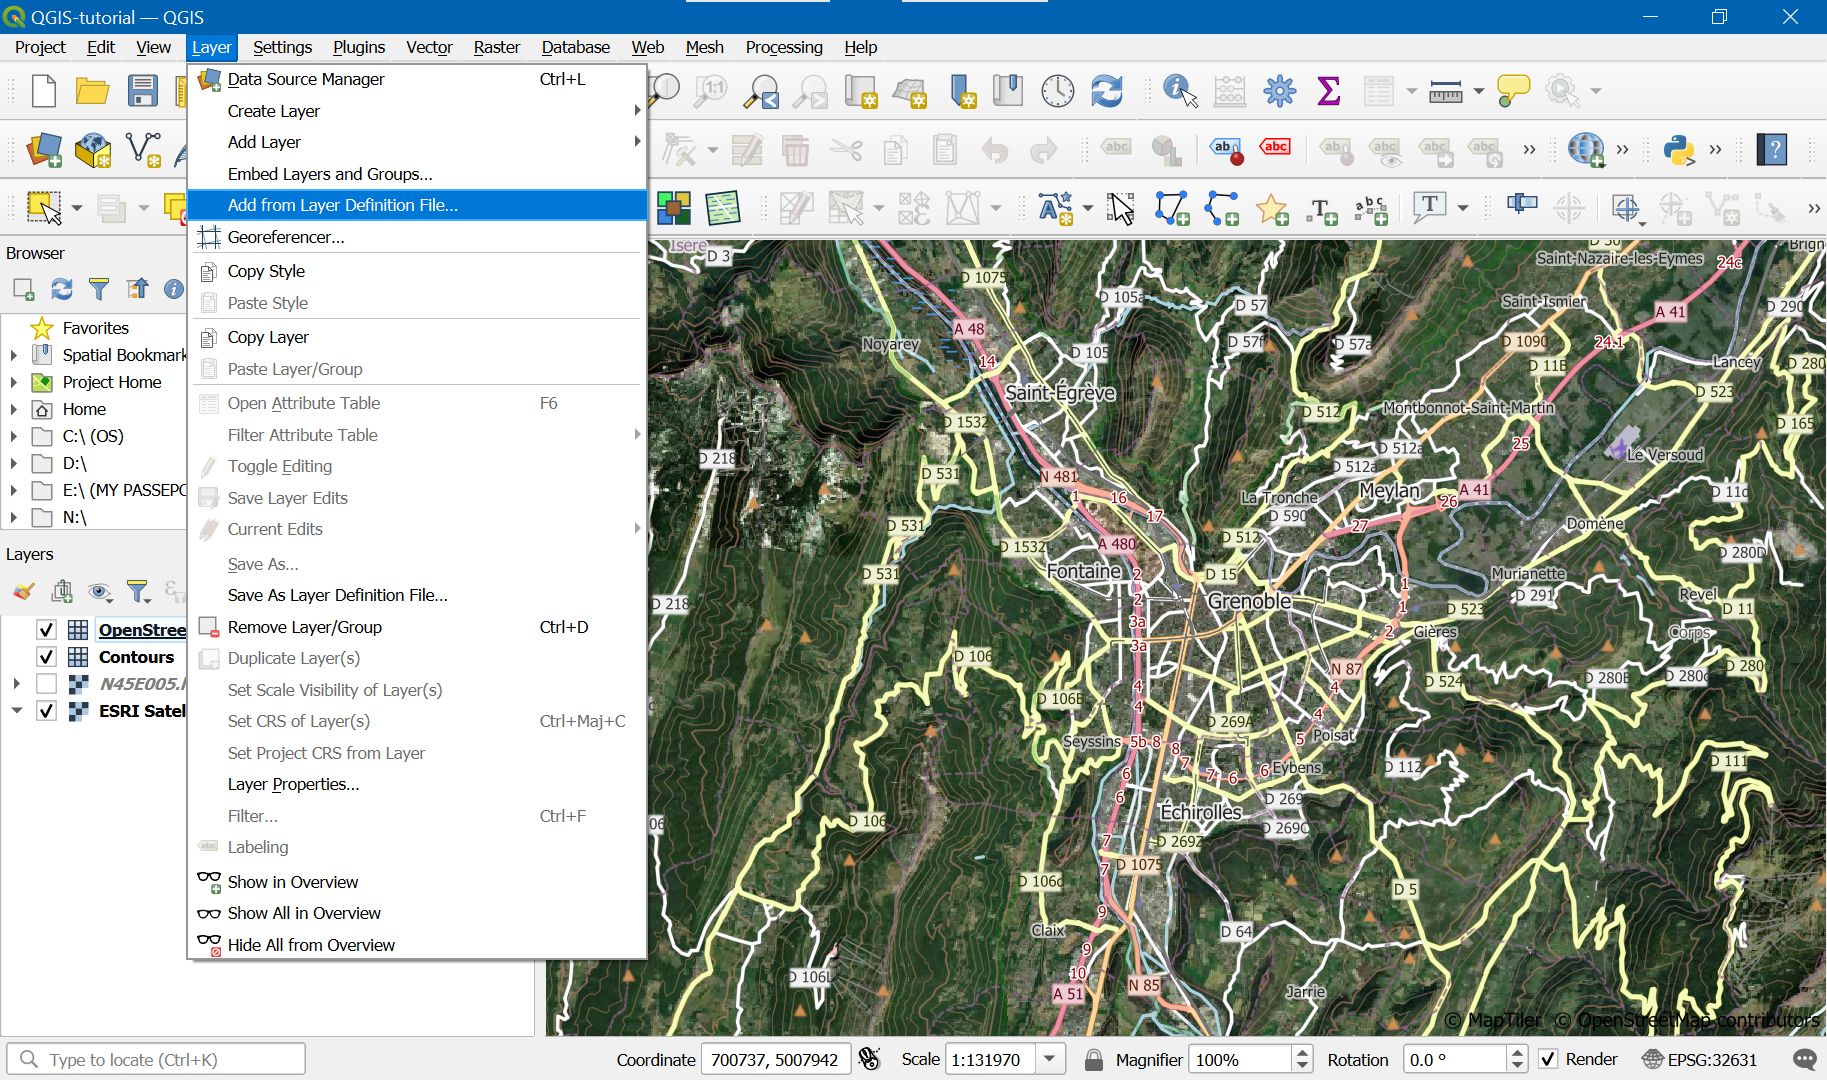
Using the browser pane on left, add Maptiler Topo.
From Maptiler topo, keep only Contours, and place it between satellite layer and overlayed map.
Check again in project properties that project coordinate reference system is the wanted one.
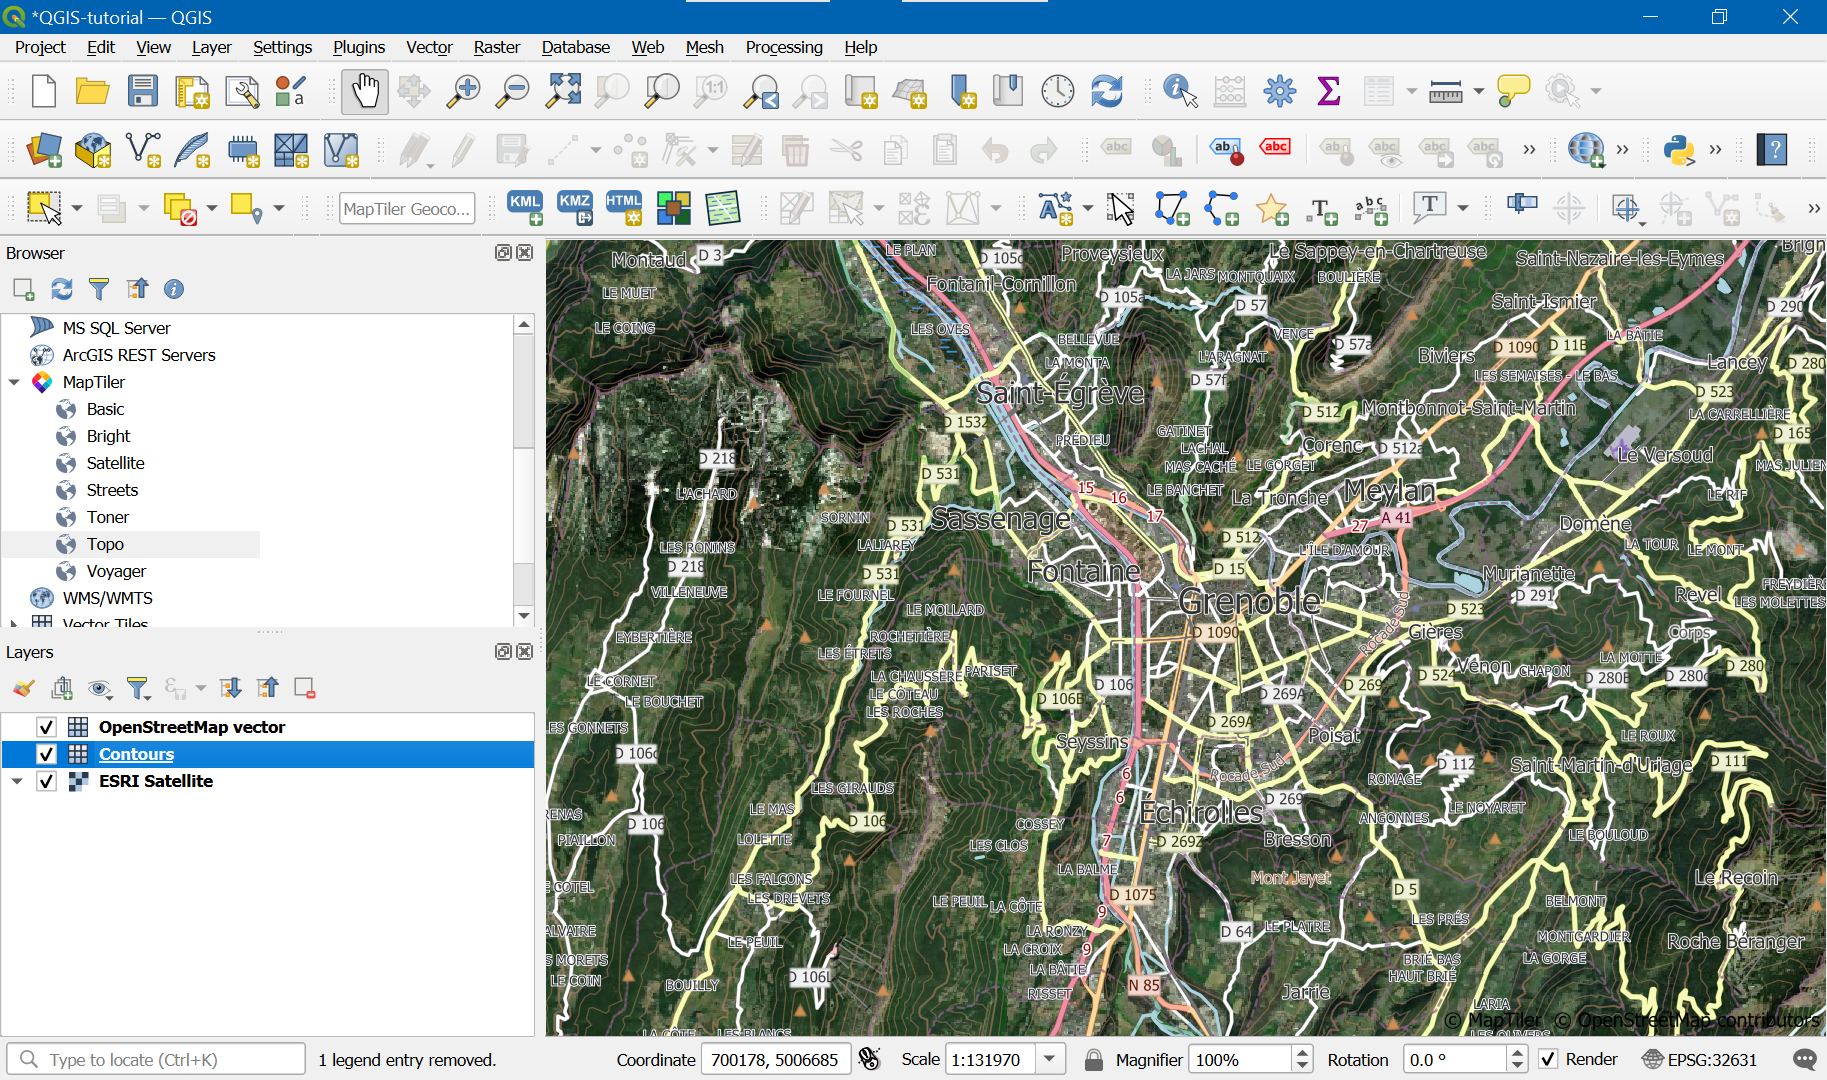
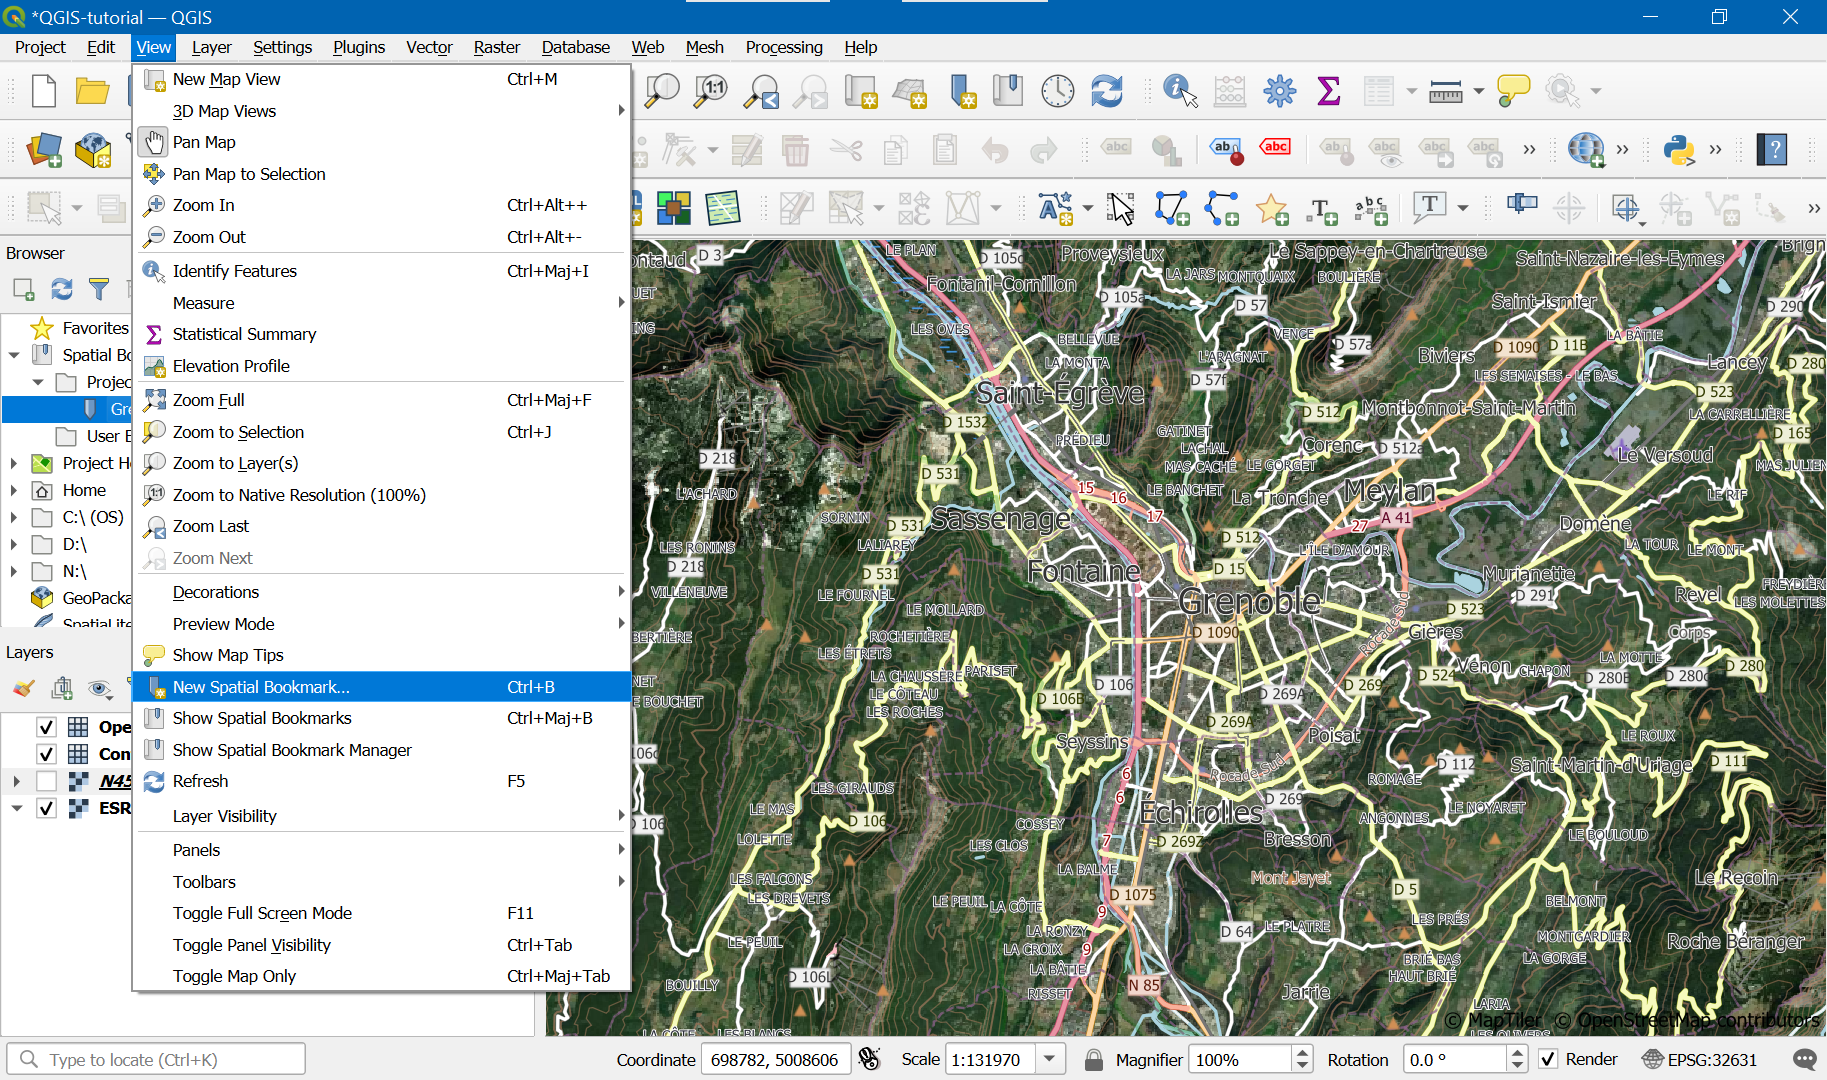
Bookmark needed area
View the extent of the area you need, next go View -> New Spatial Bookmark… (Ctrl B):
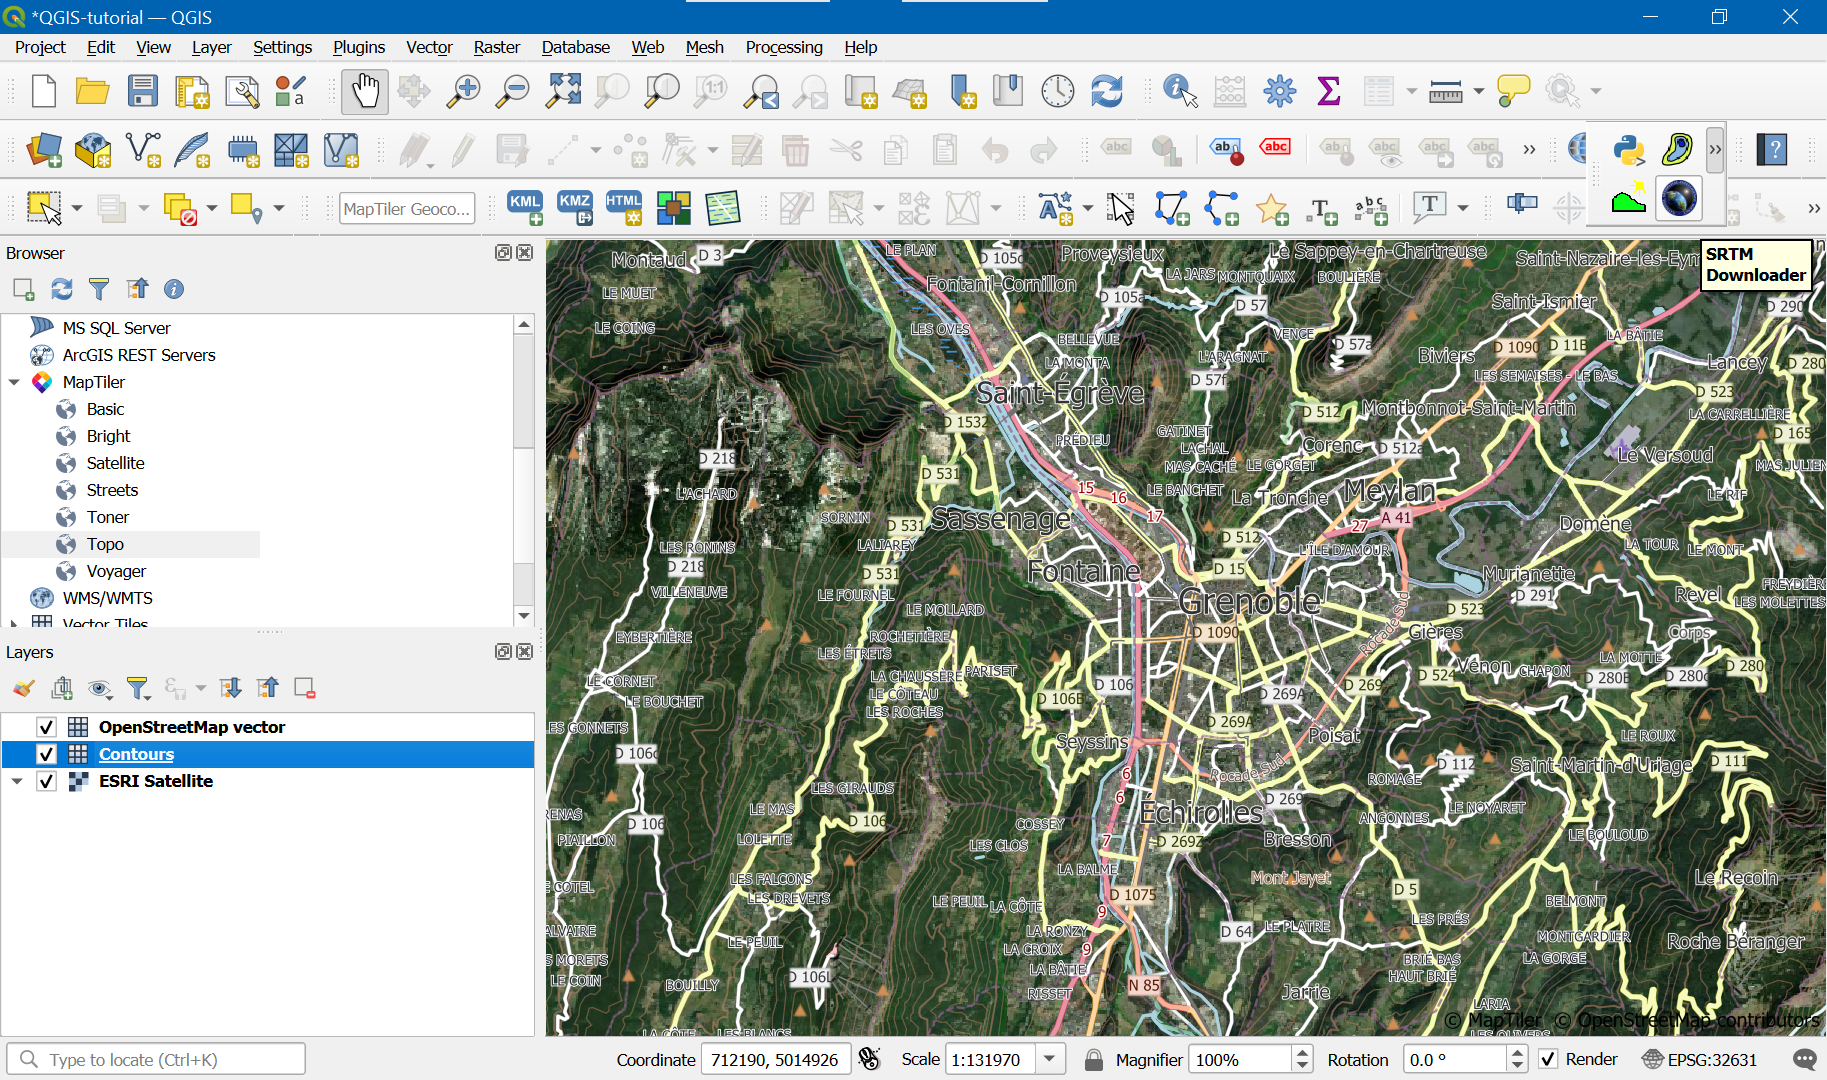
Height map preparation
Double-click on bookmark to be sure the display canvas matches it. Download height maps using the SRTM downloader icon:
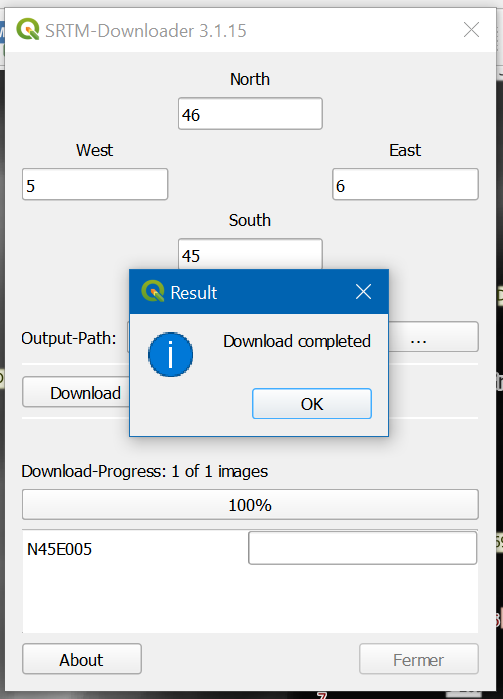
Click set canvas extent, and put « ./ » in output path:
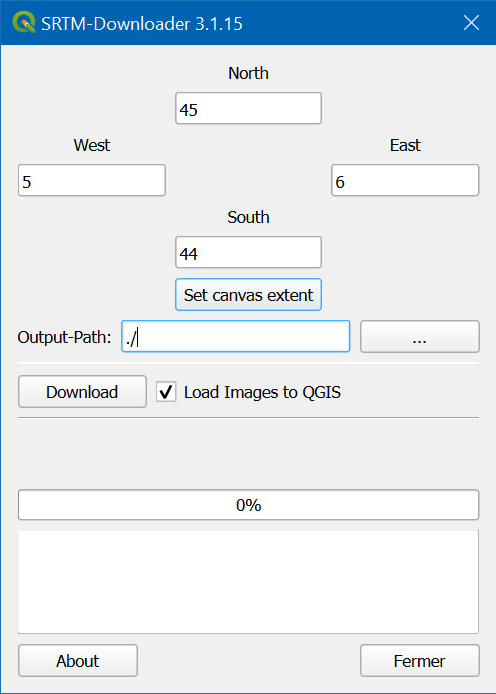
Usually, STRM downloader downloads only a single SRTM maps since their map cutting is quite big:
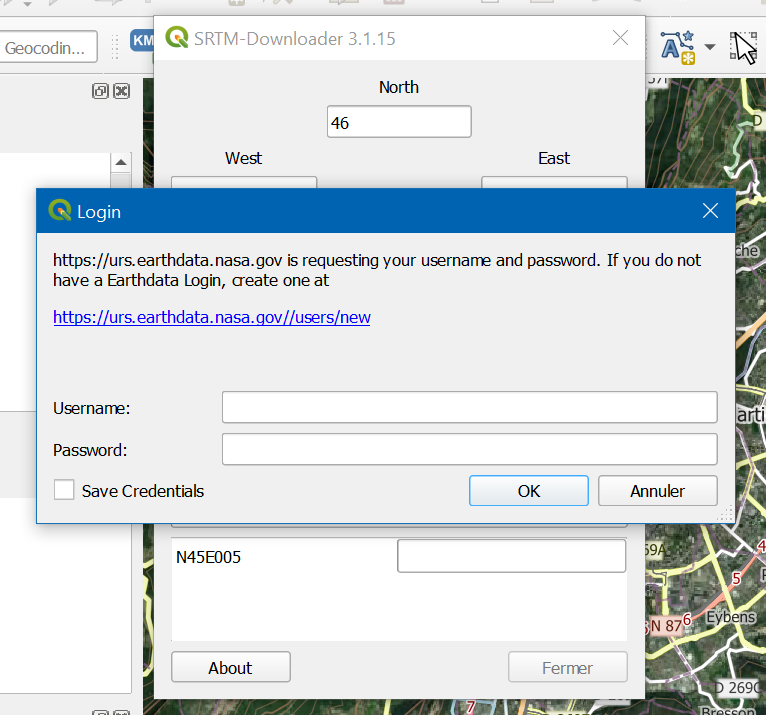
Here, KeePass and Ctrl+Alt+A can be quite useful.
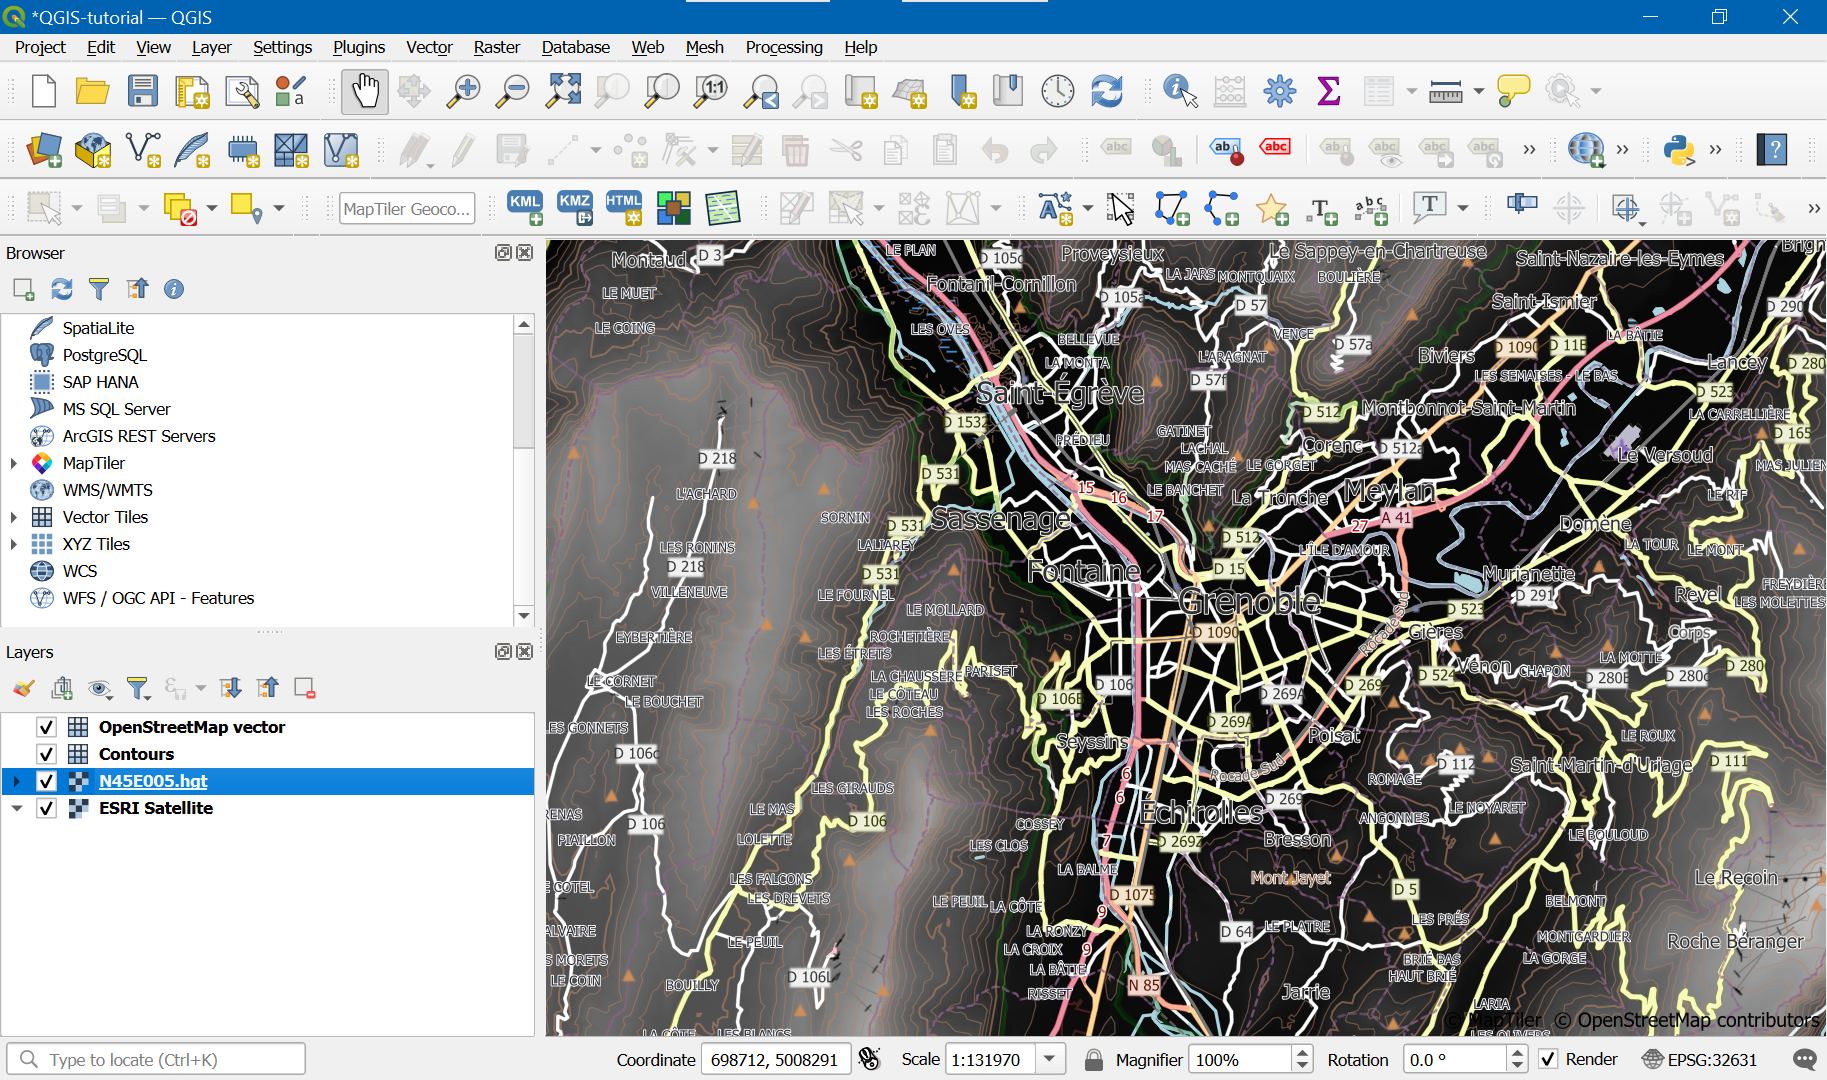
After the layer being downloaded, you should see it. Reorder the layers to check it matches other layers:
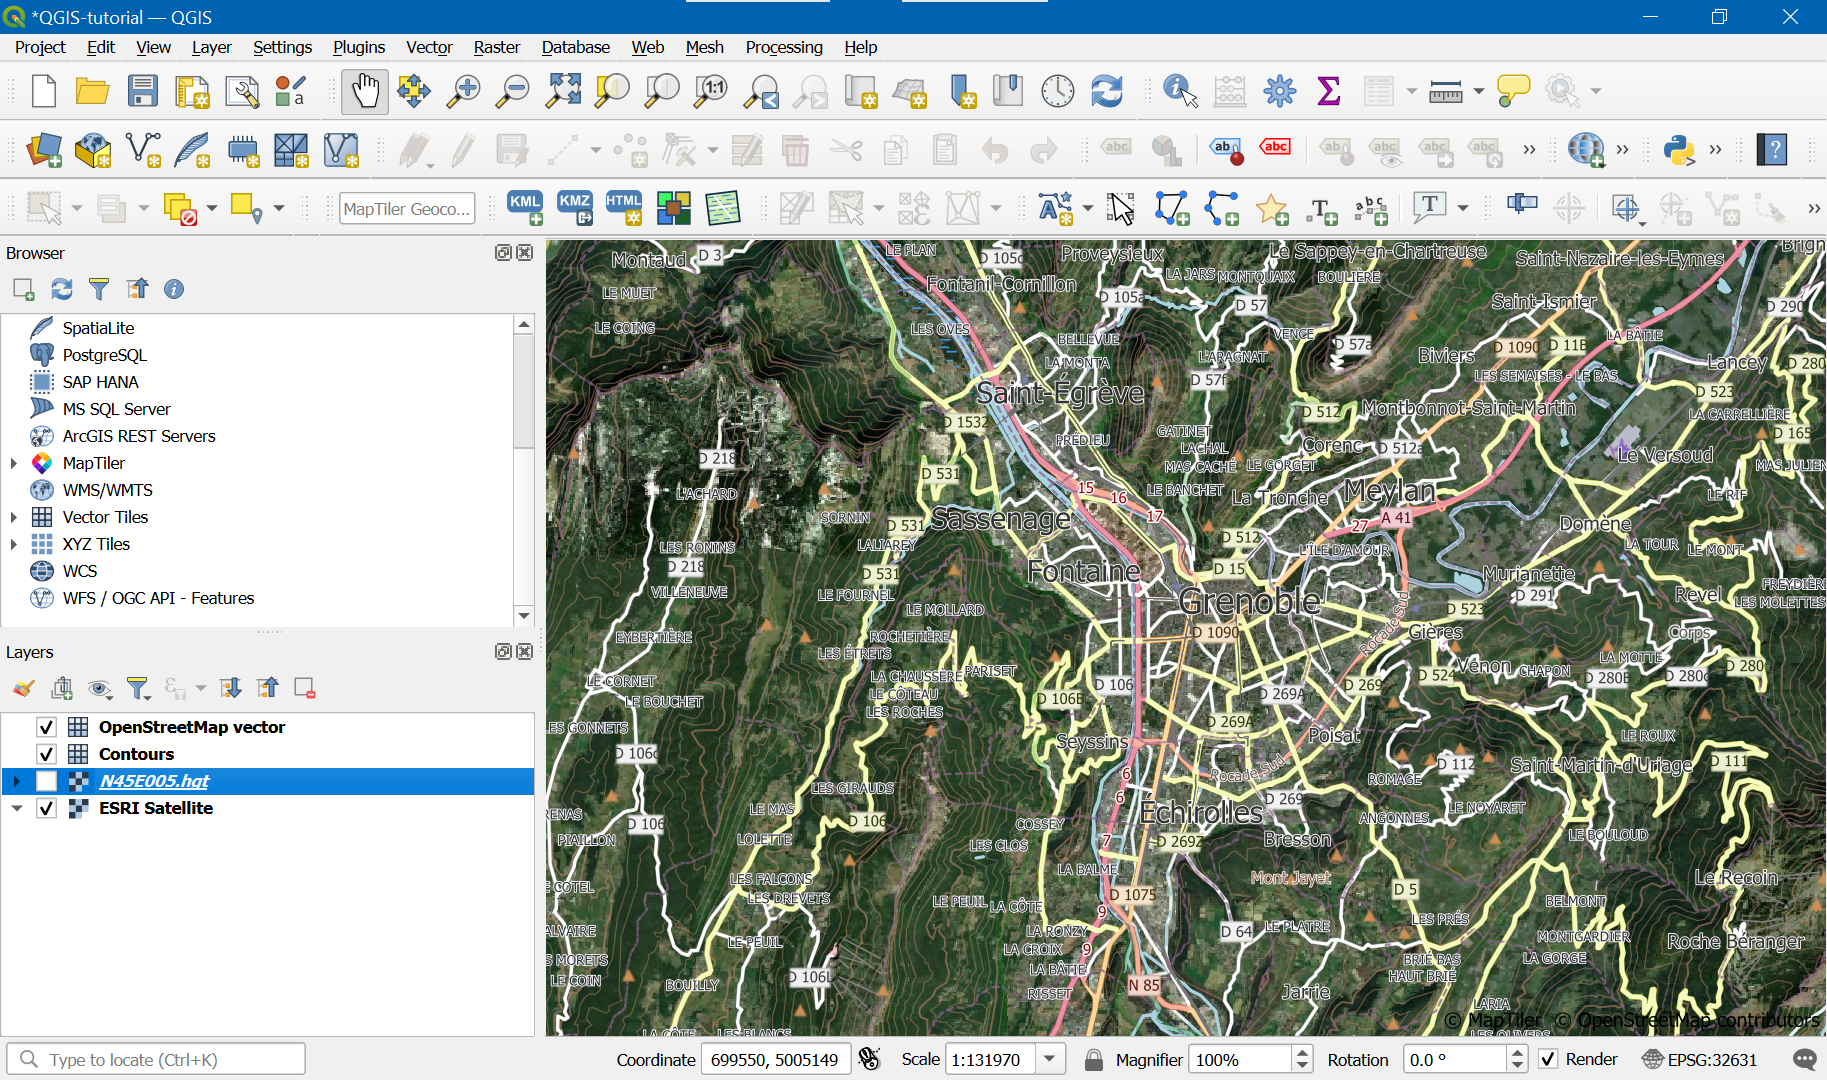
Next, uncheck the height layer but keep it:
Map and height map export
Map export
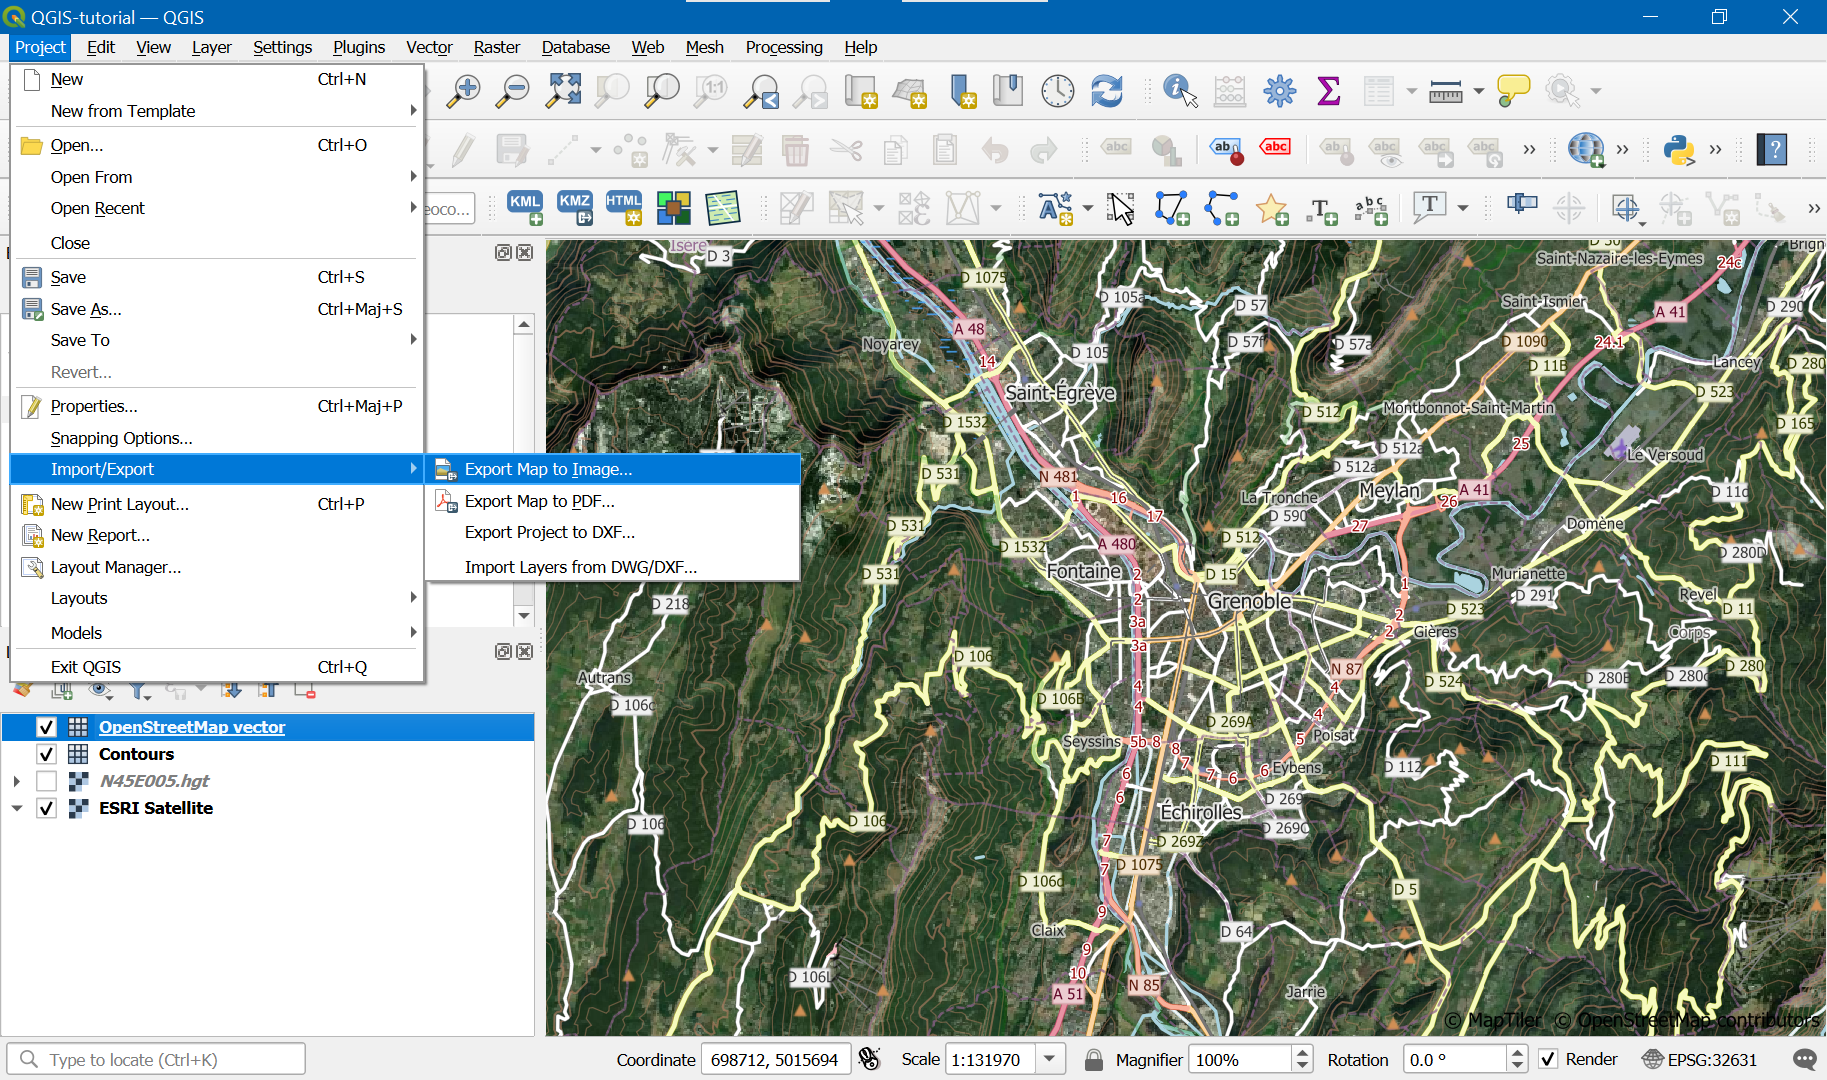
Go to Project -> Export -> Export Map to Image:
Select first the suitable scale and resolution (good values are 1:40000, 300 dpi) and next select your bookmark:
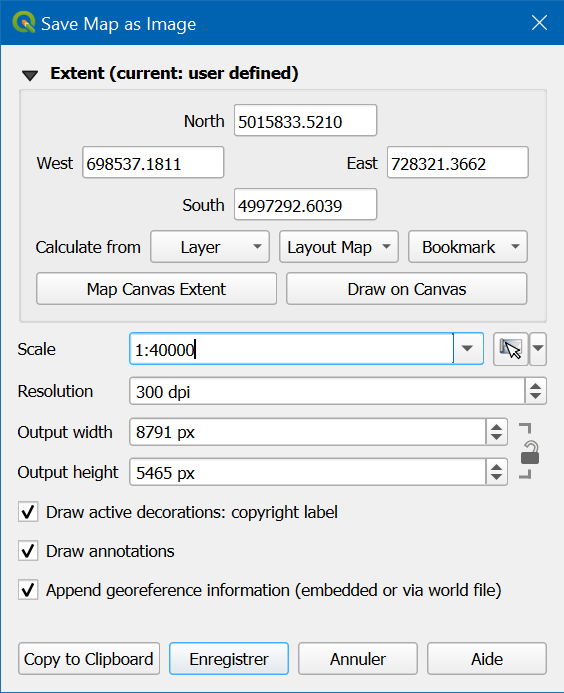
Save as JPG format, convenient because satellite images hard to compress in PNG.
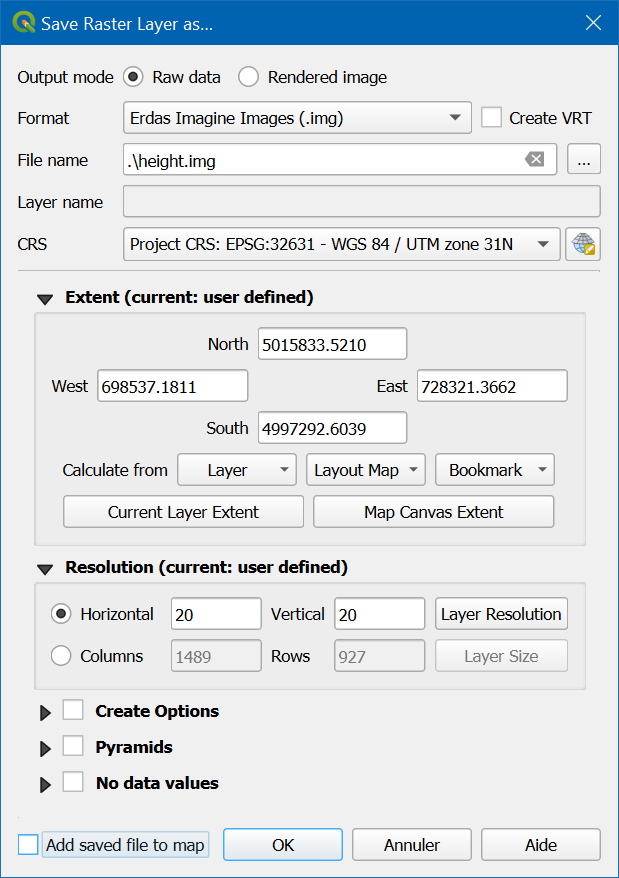
Height map export
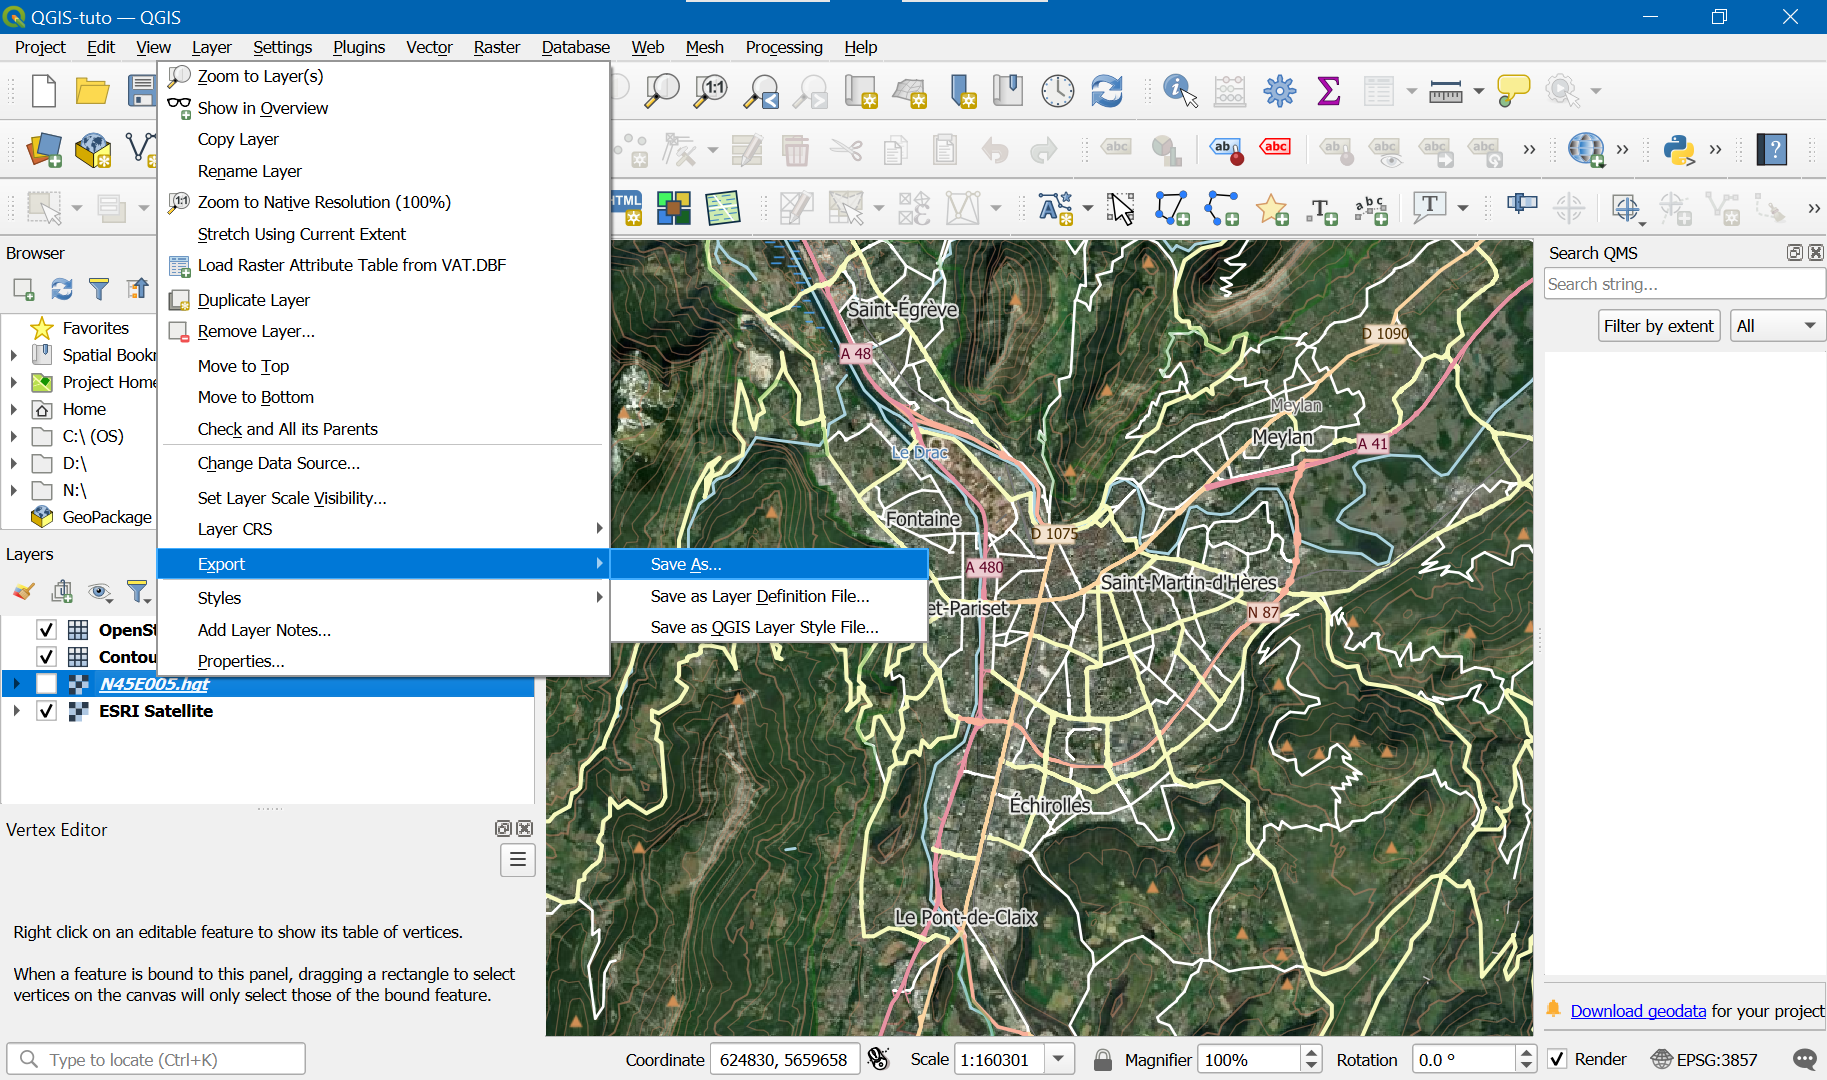
Settings :
- Select « Raw Data ».
- Select « Erdas Imagine Images(.img).
- Select CRS WRS 84 / UTM correct zone.
- Extent : select bookmarks.
- Resolution : round the best (lowest) value and use it for both horizontal and vertical because Atoll can’t handle different resolution on the axes.
Atoll
Coordinate reference system
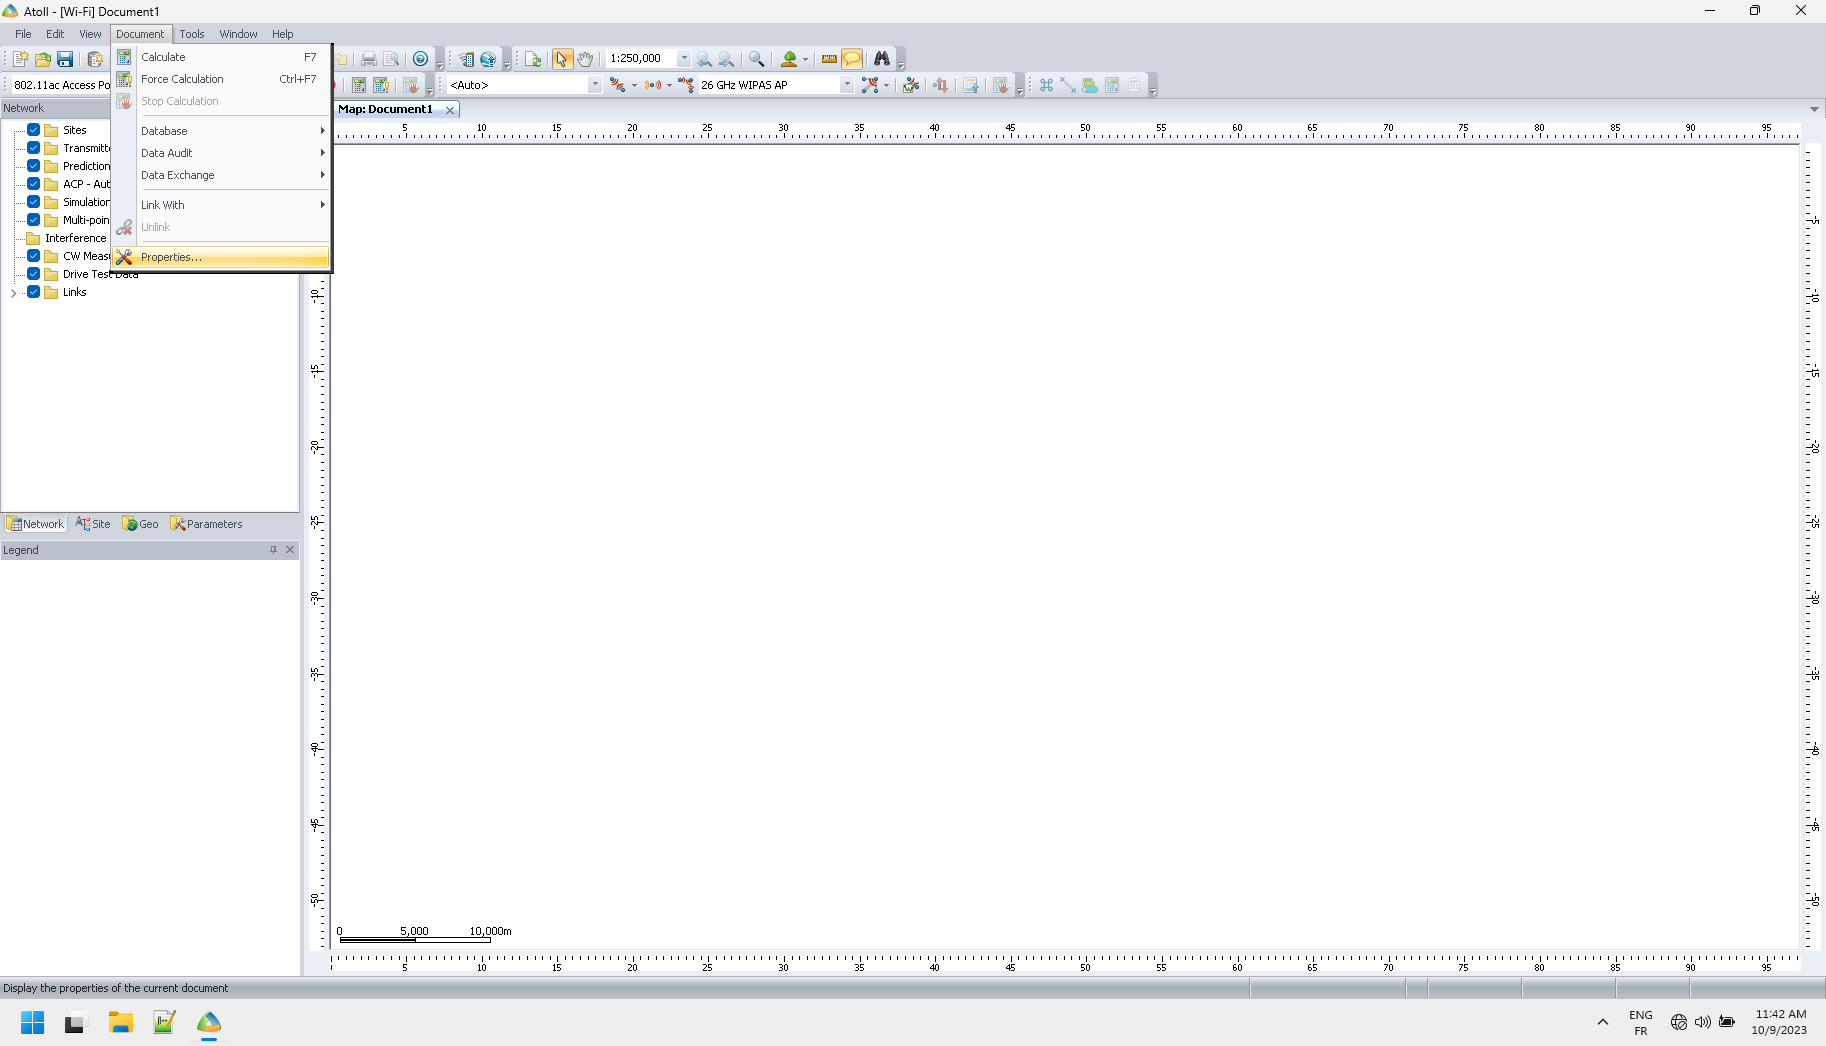
In your project, go do Document -> Properties…:
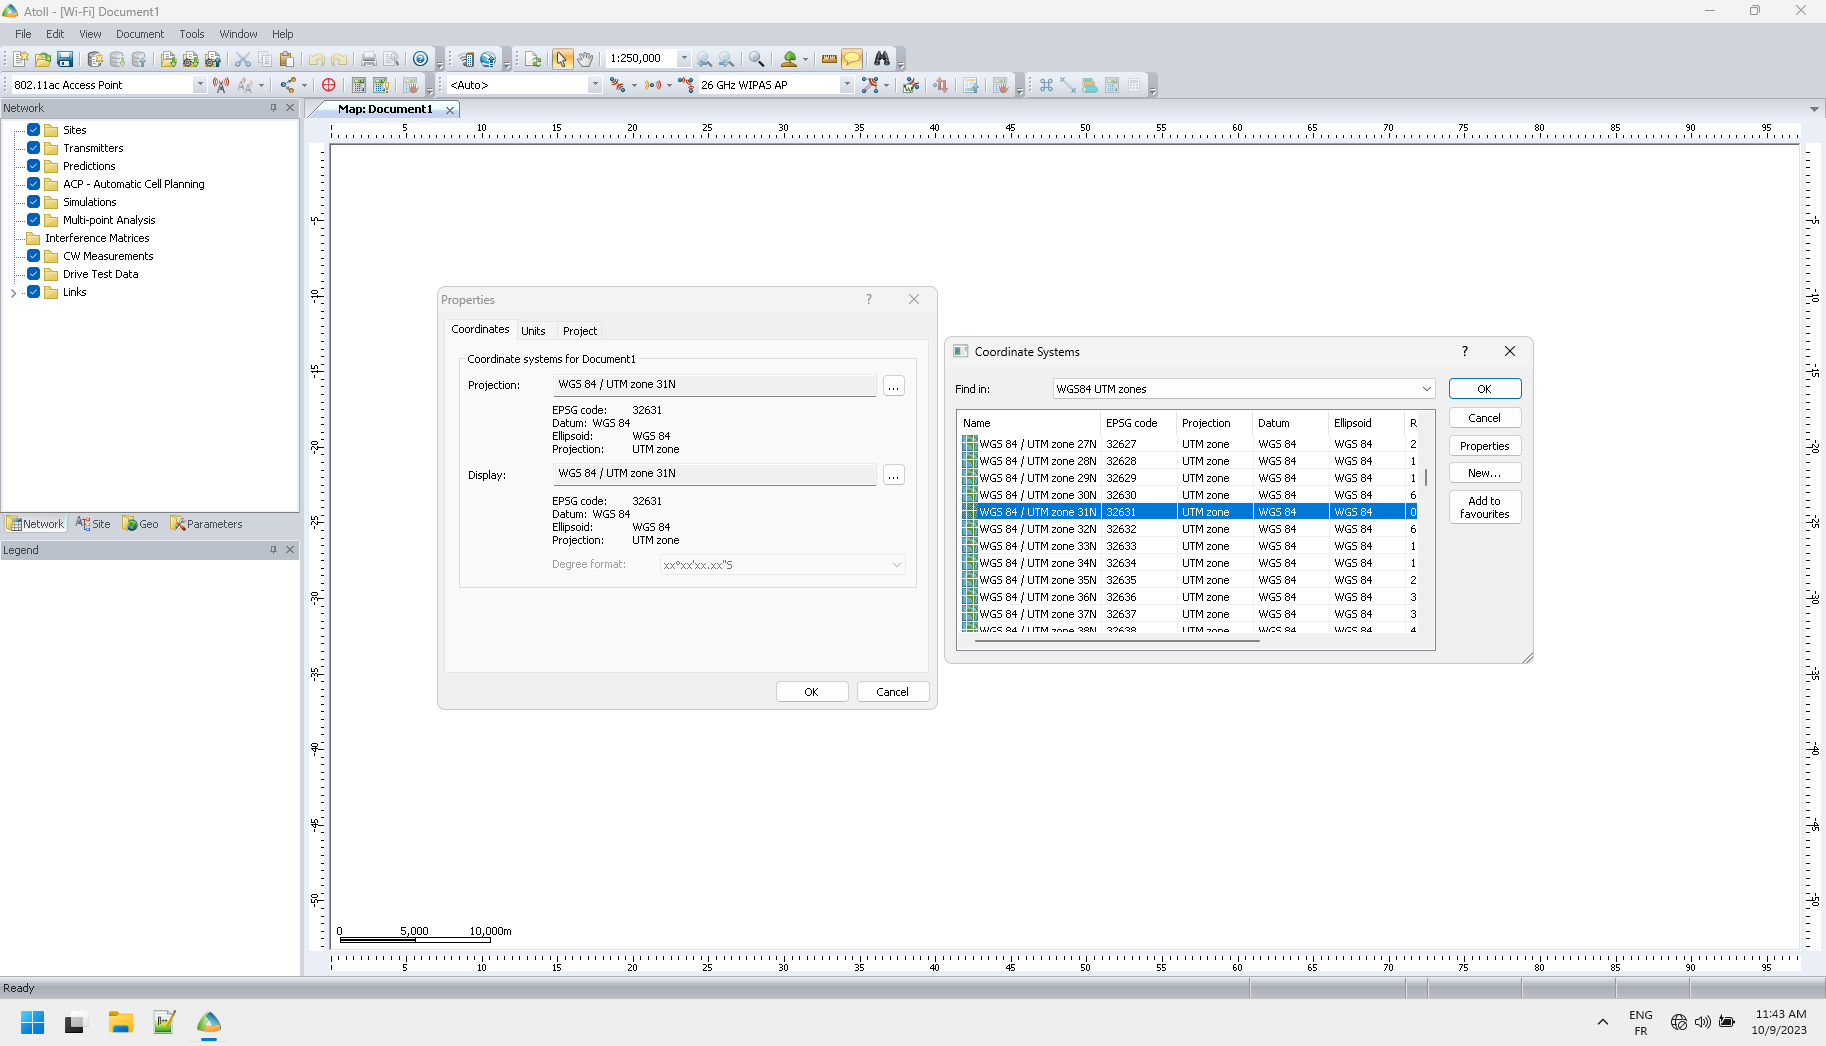
Next, select WGS 84 / UTM correct zone for projection and display:
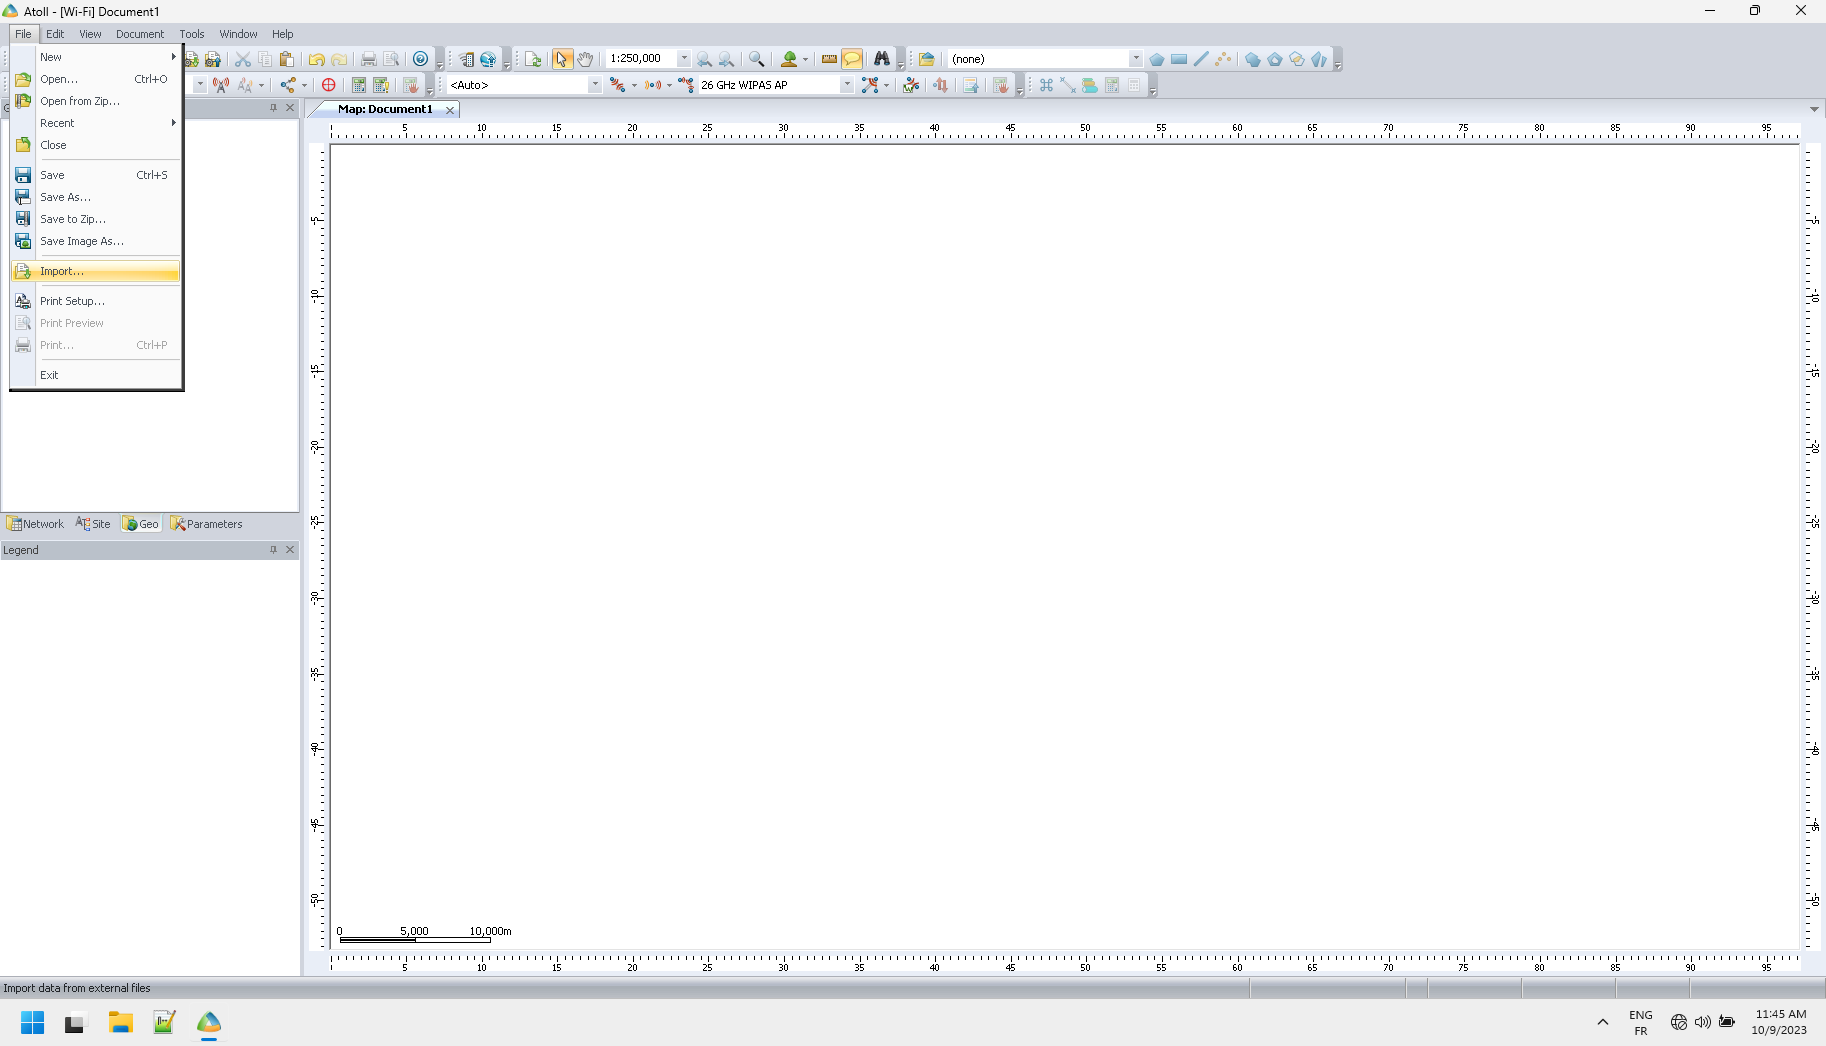
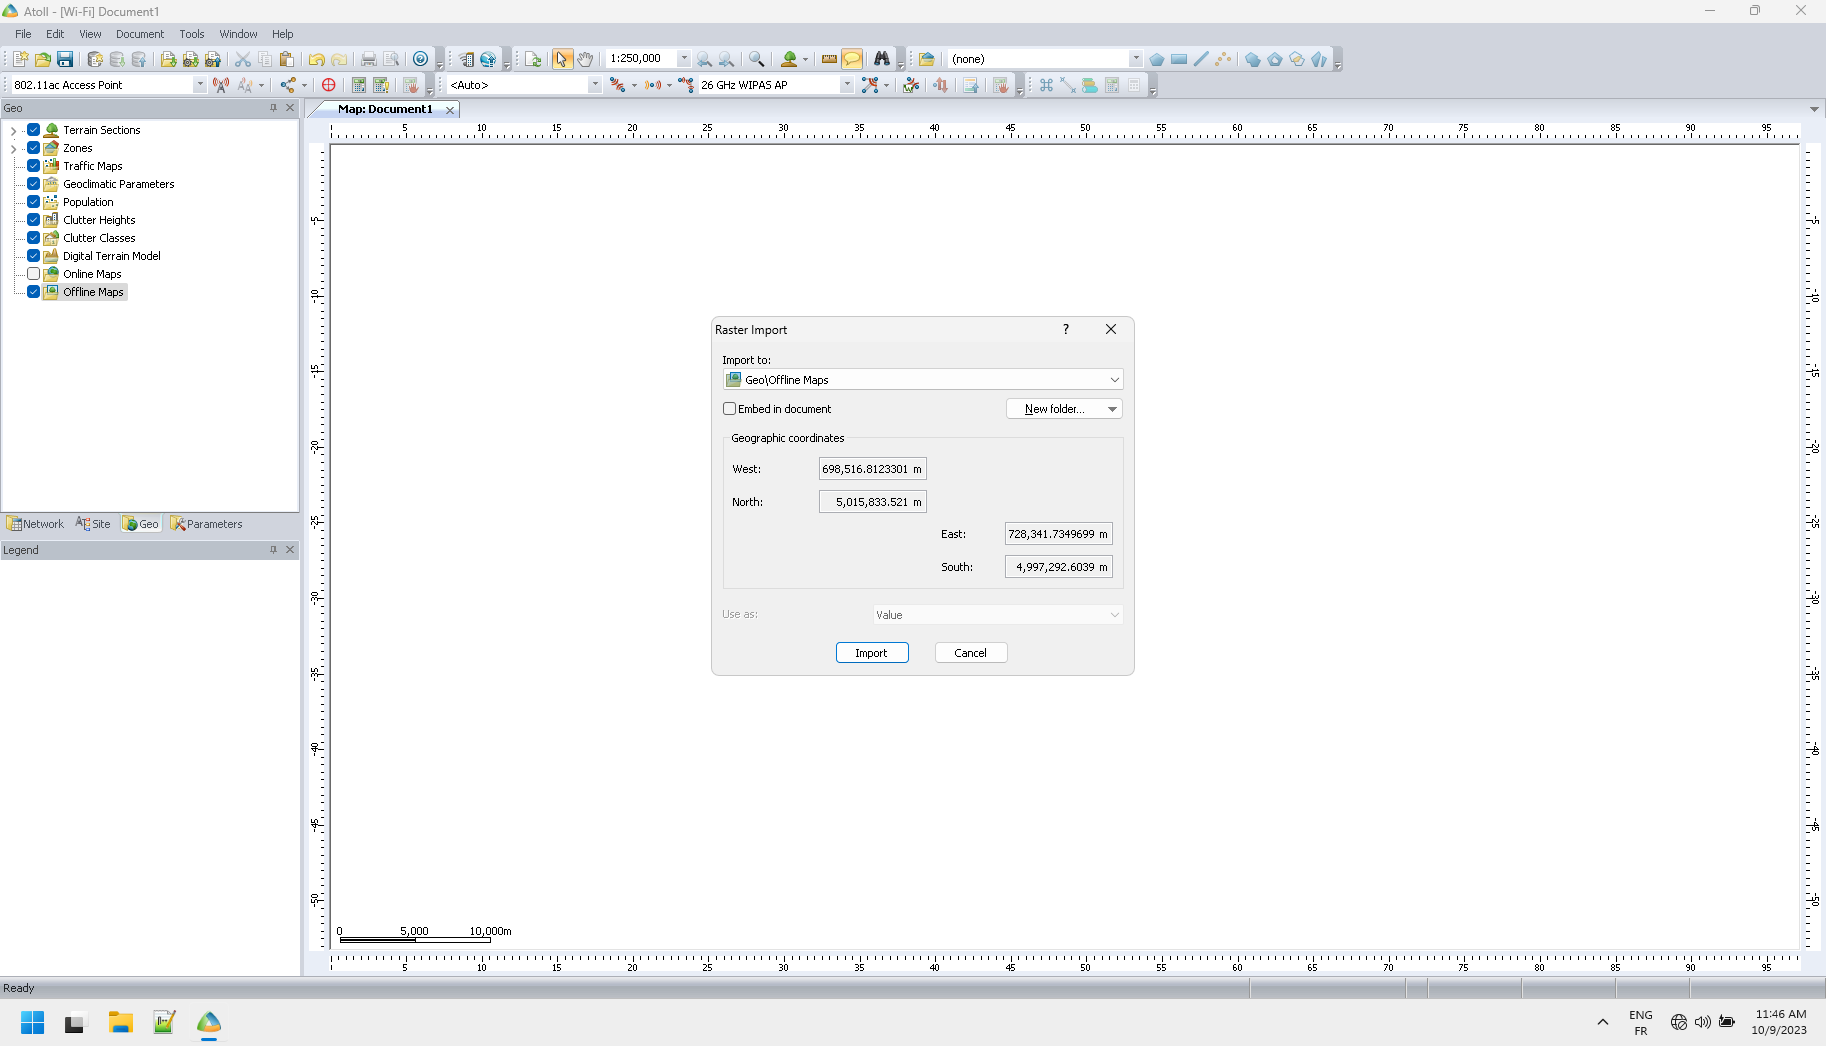
Map import
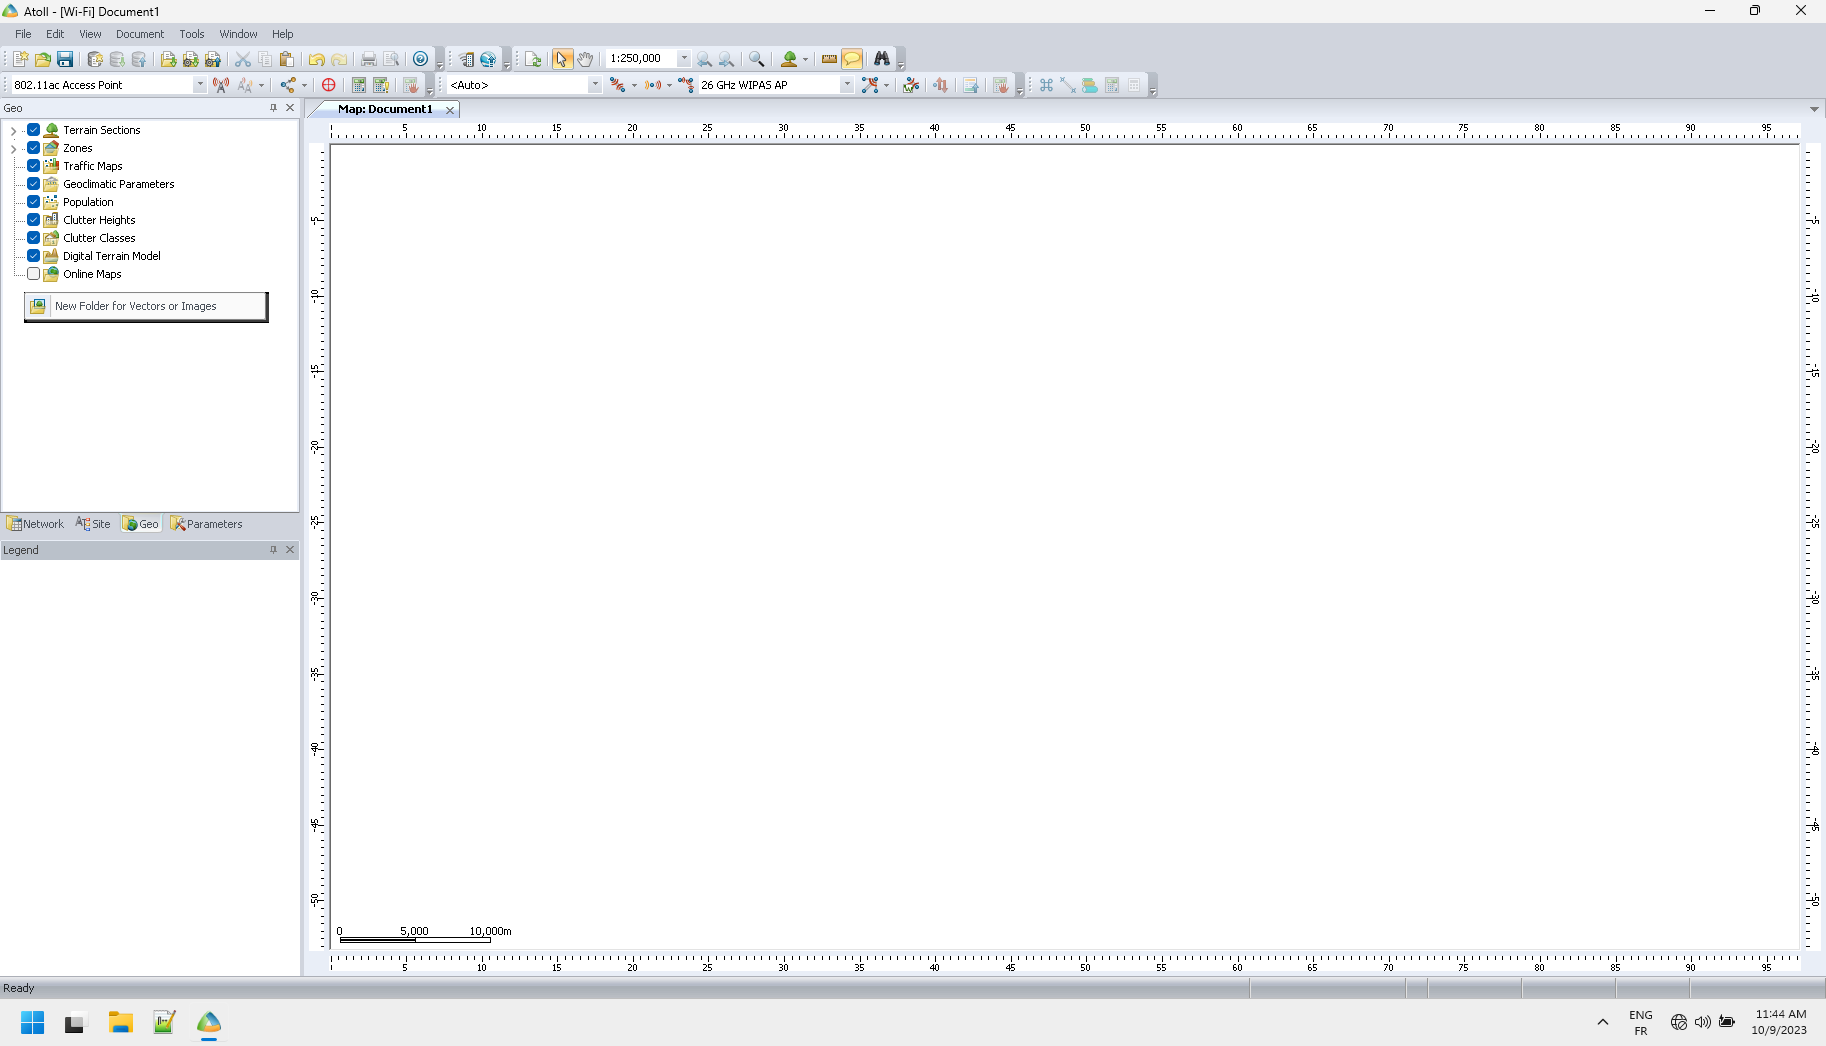
In Geo tab, create an Offline Maps folder for the created map:
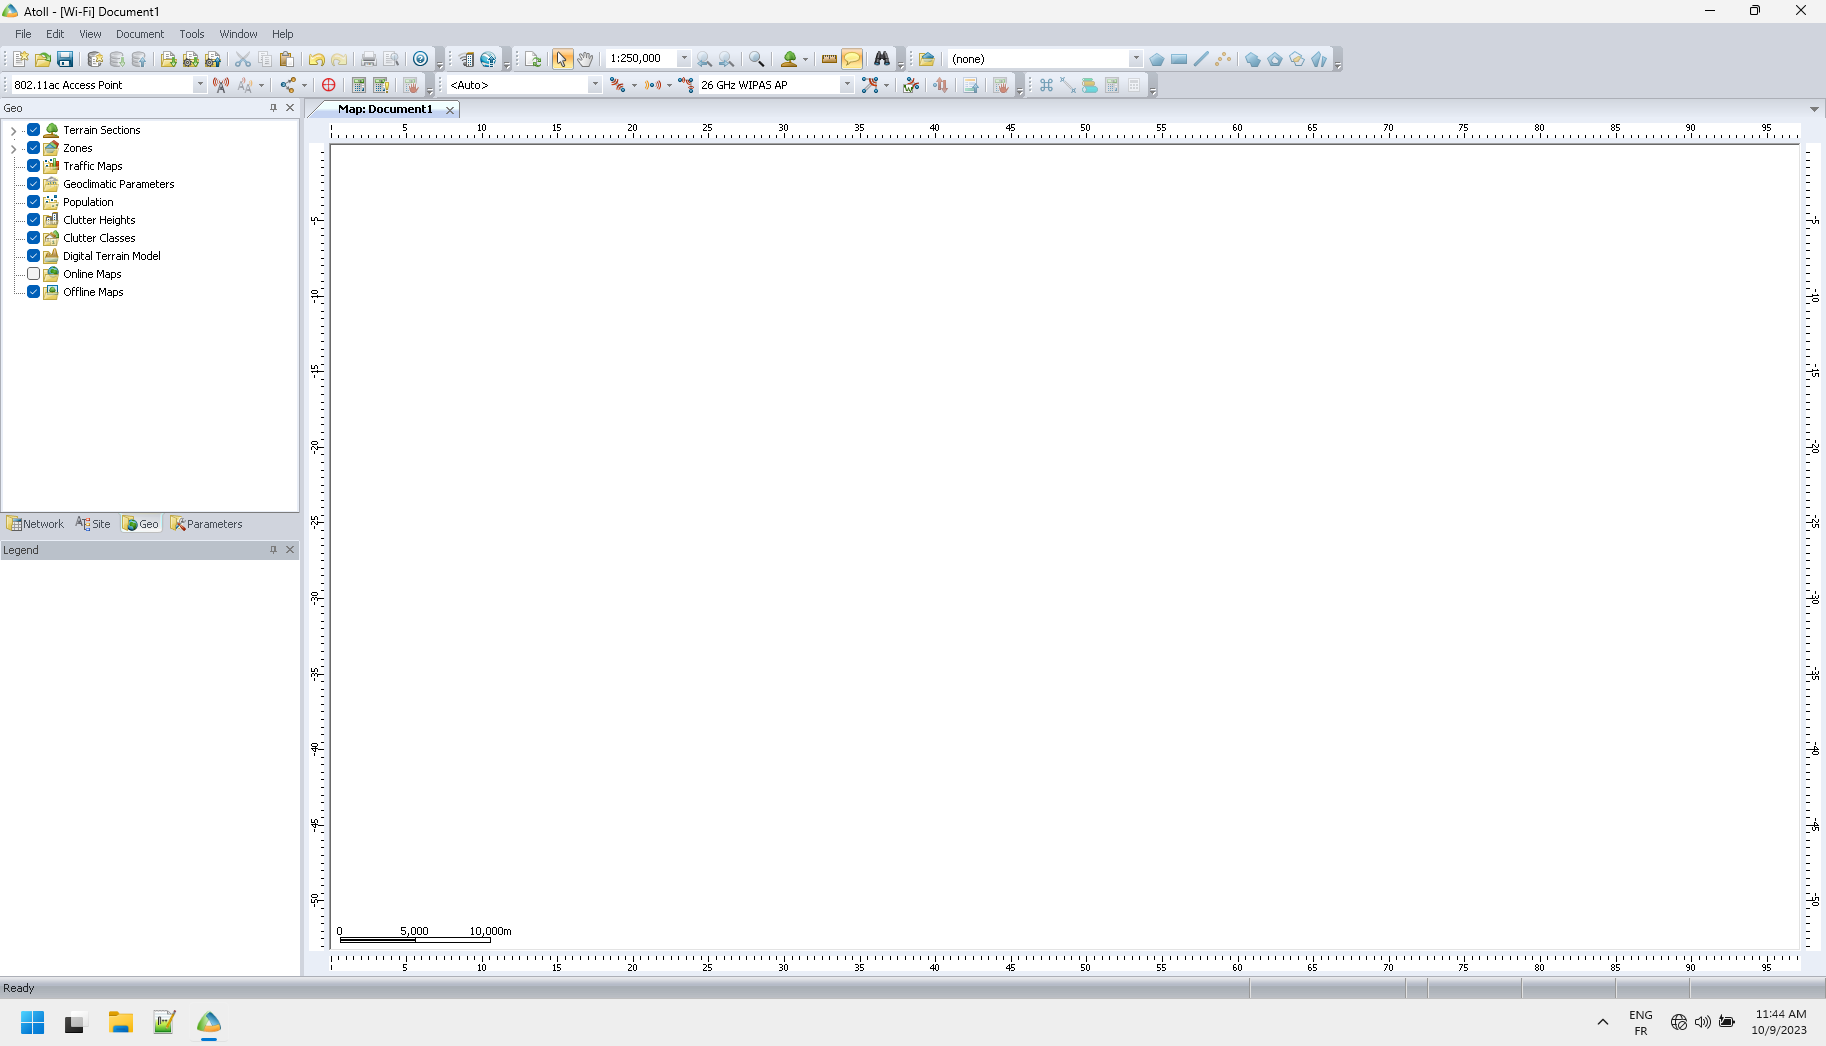
Import the map into Offline Maps:
Height map import
Next, import the height file:
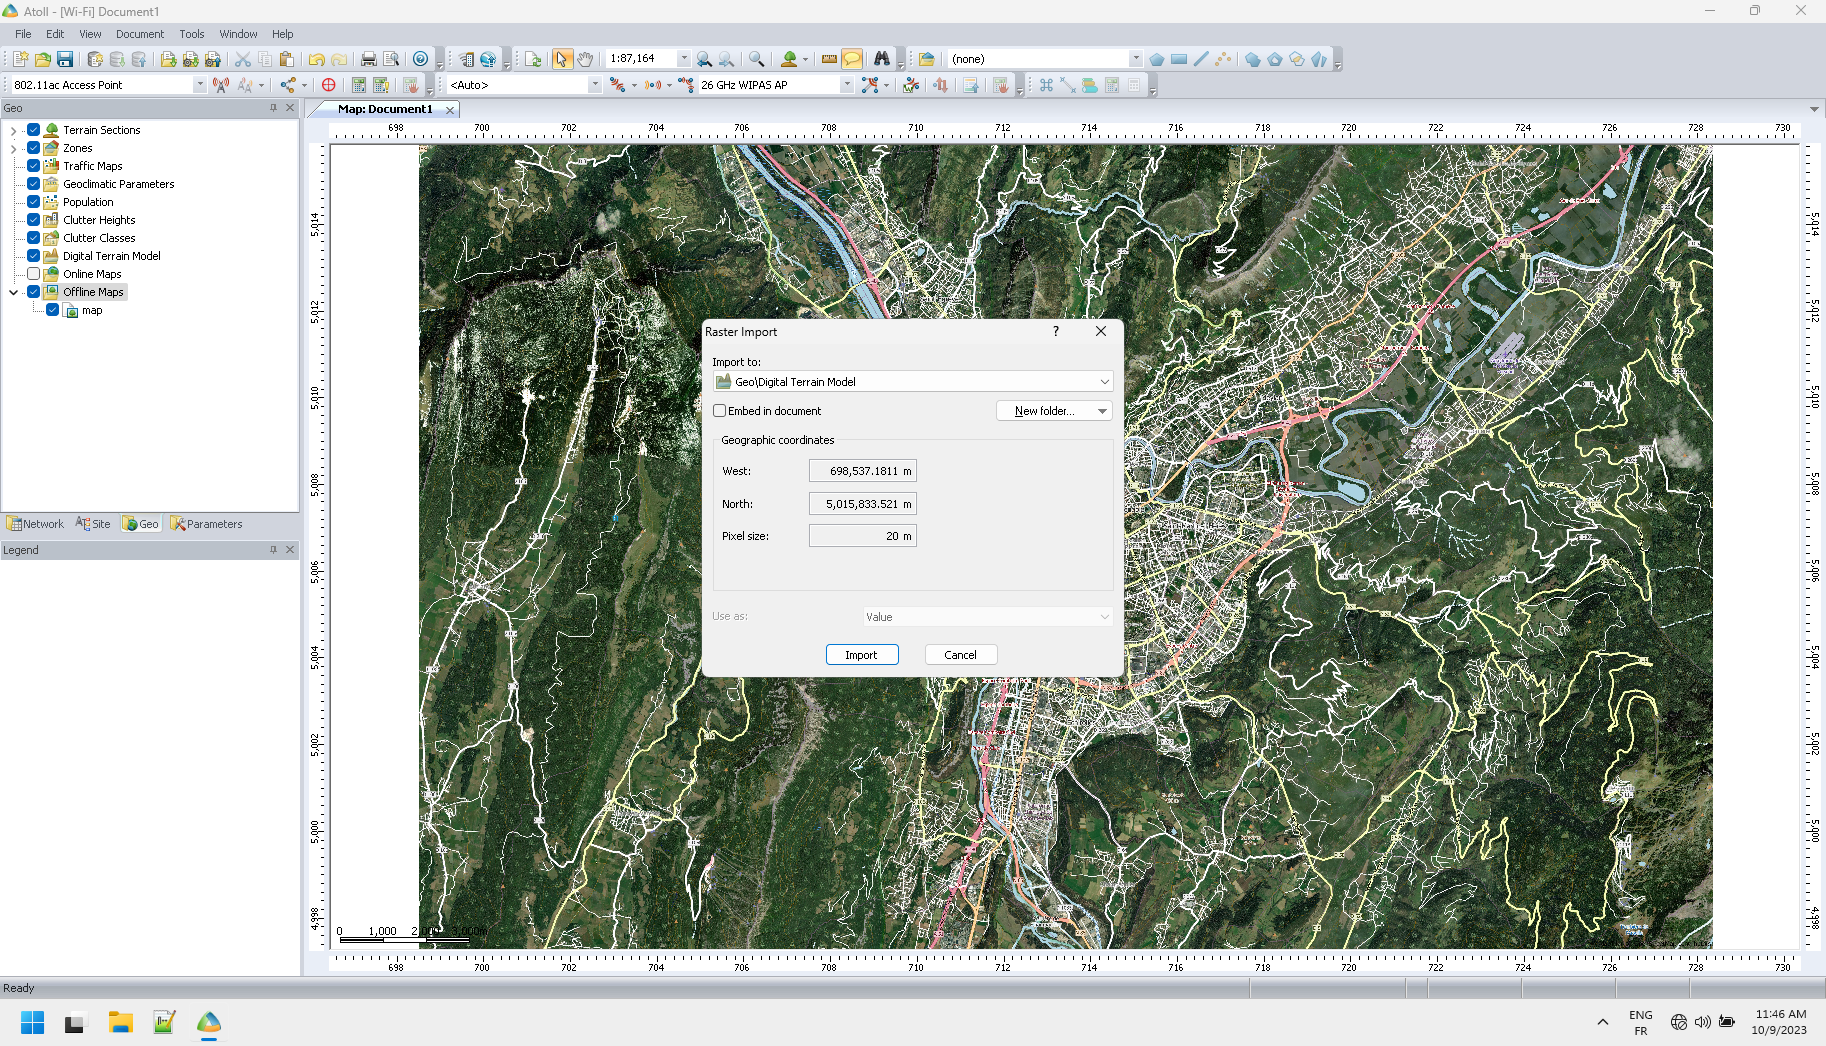
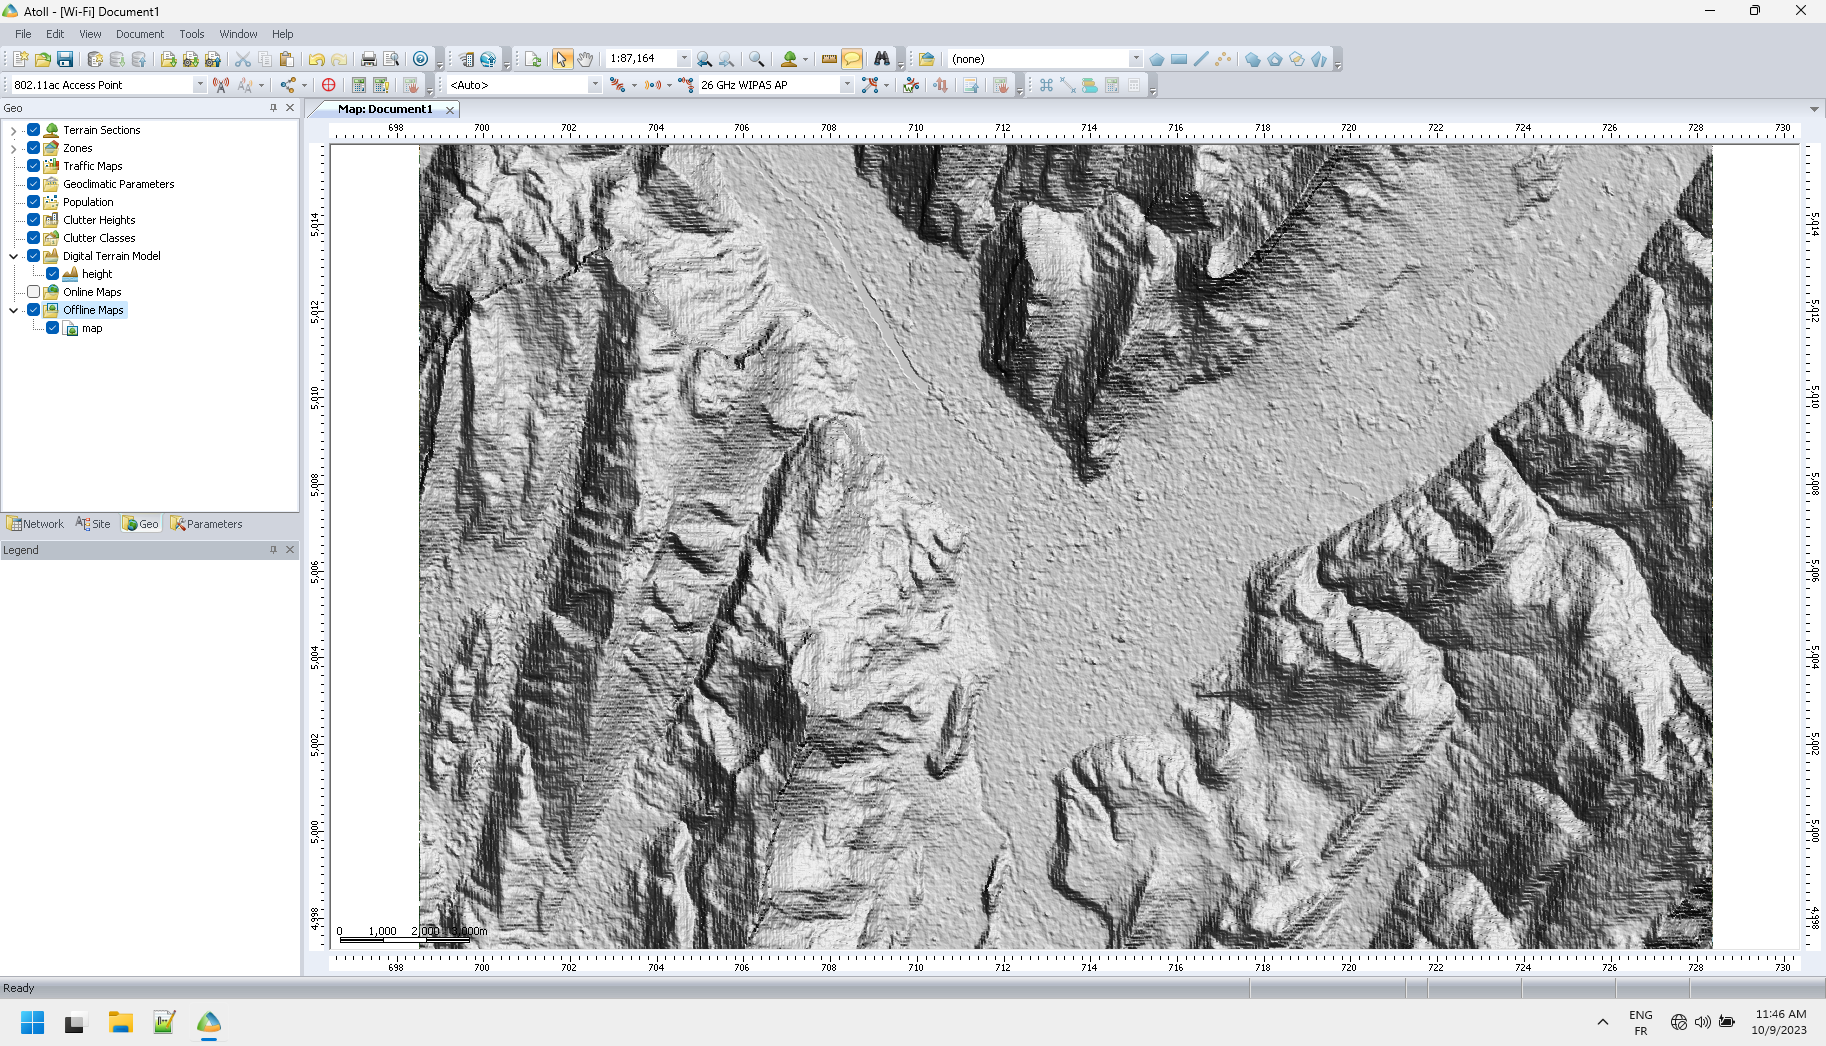
Note both maps covers the same area of the QGIS bookmark. Once the correctness of the height map import is checked, this layer can be hidden, still it will be correctly taken into accout for calculations.
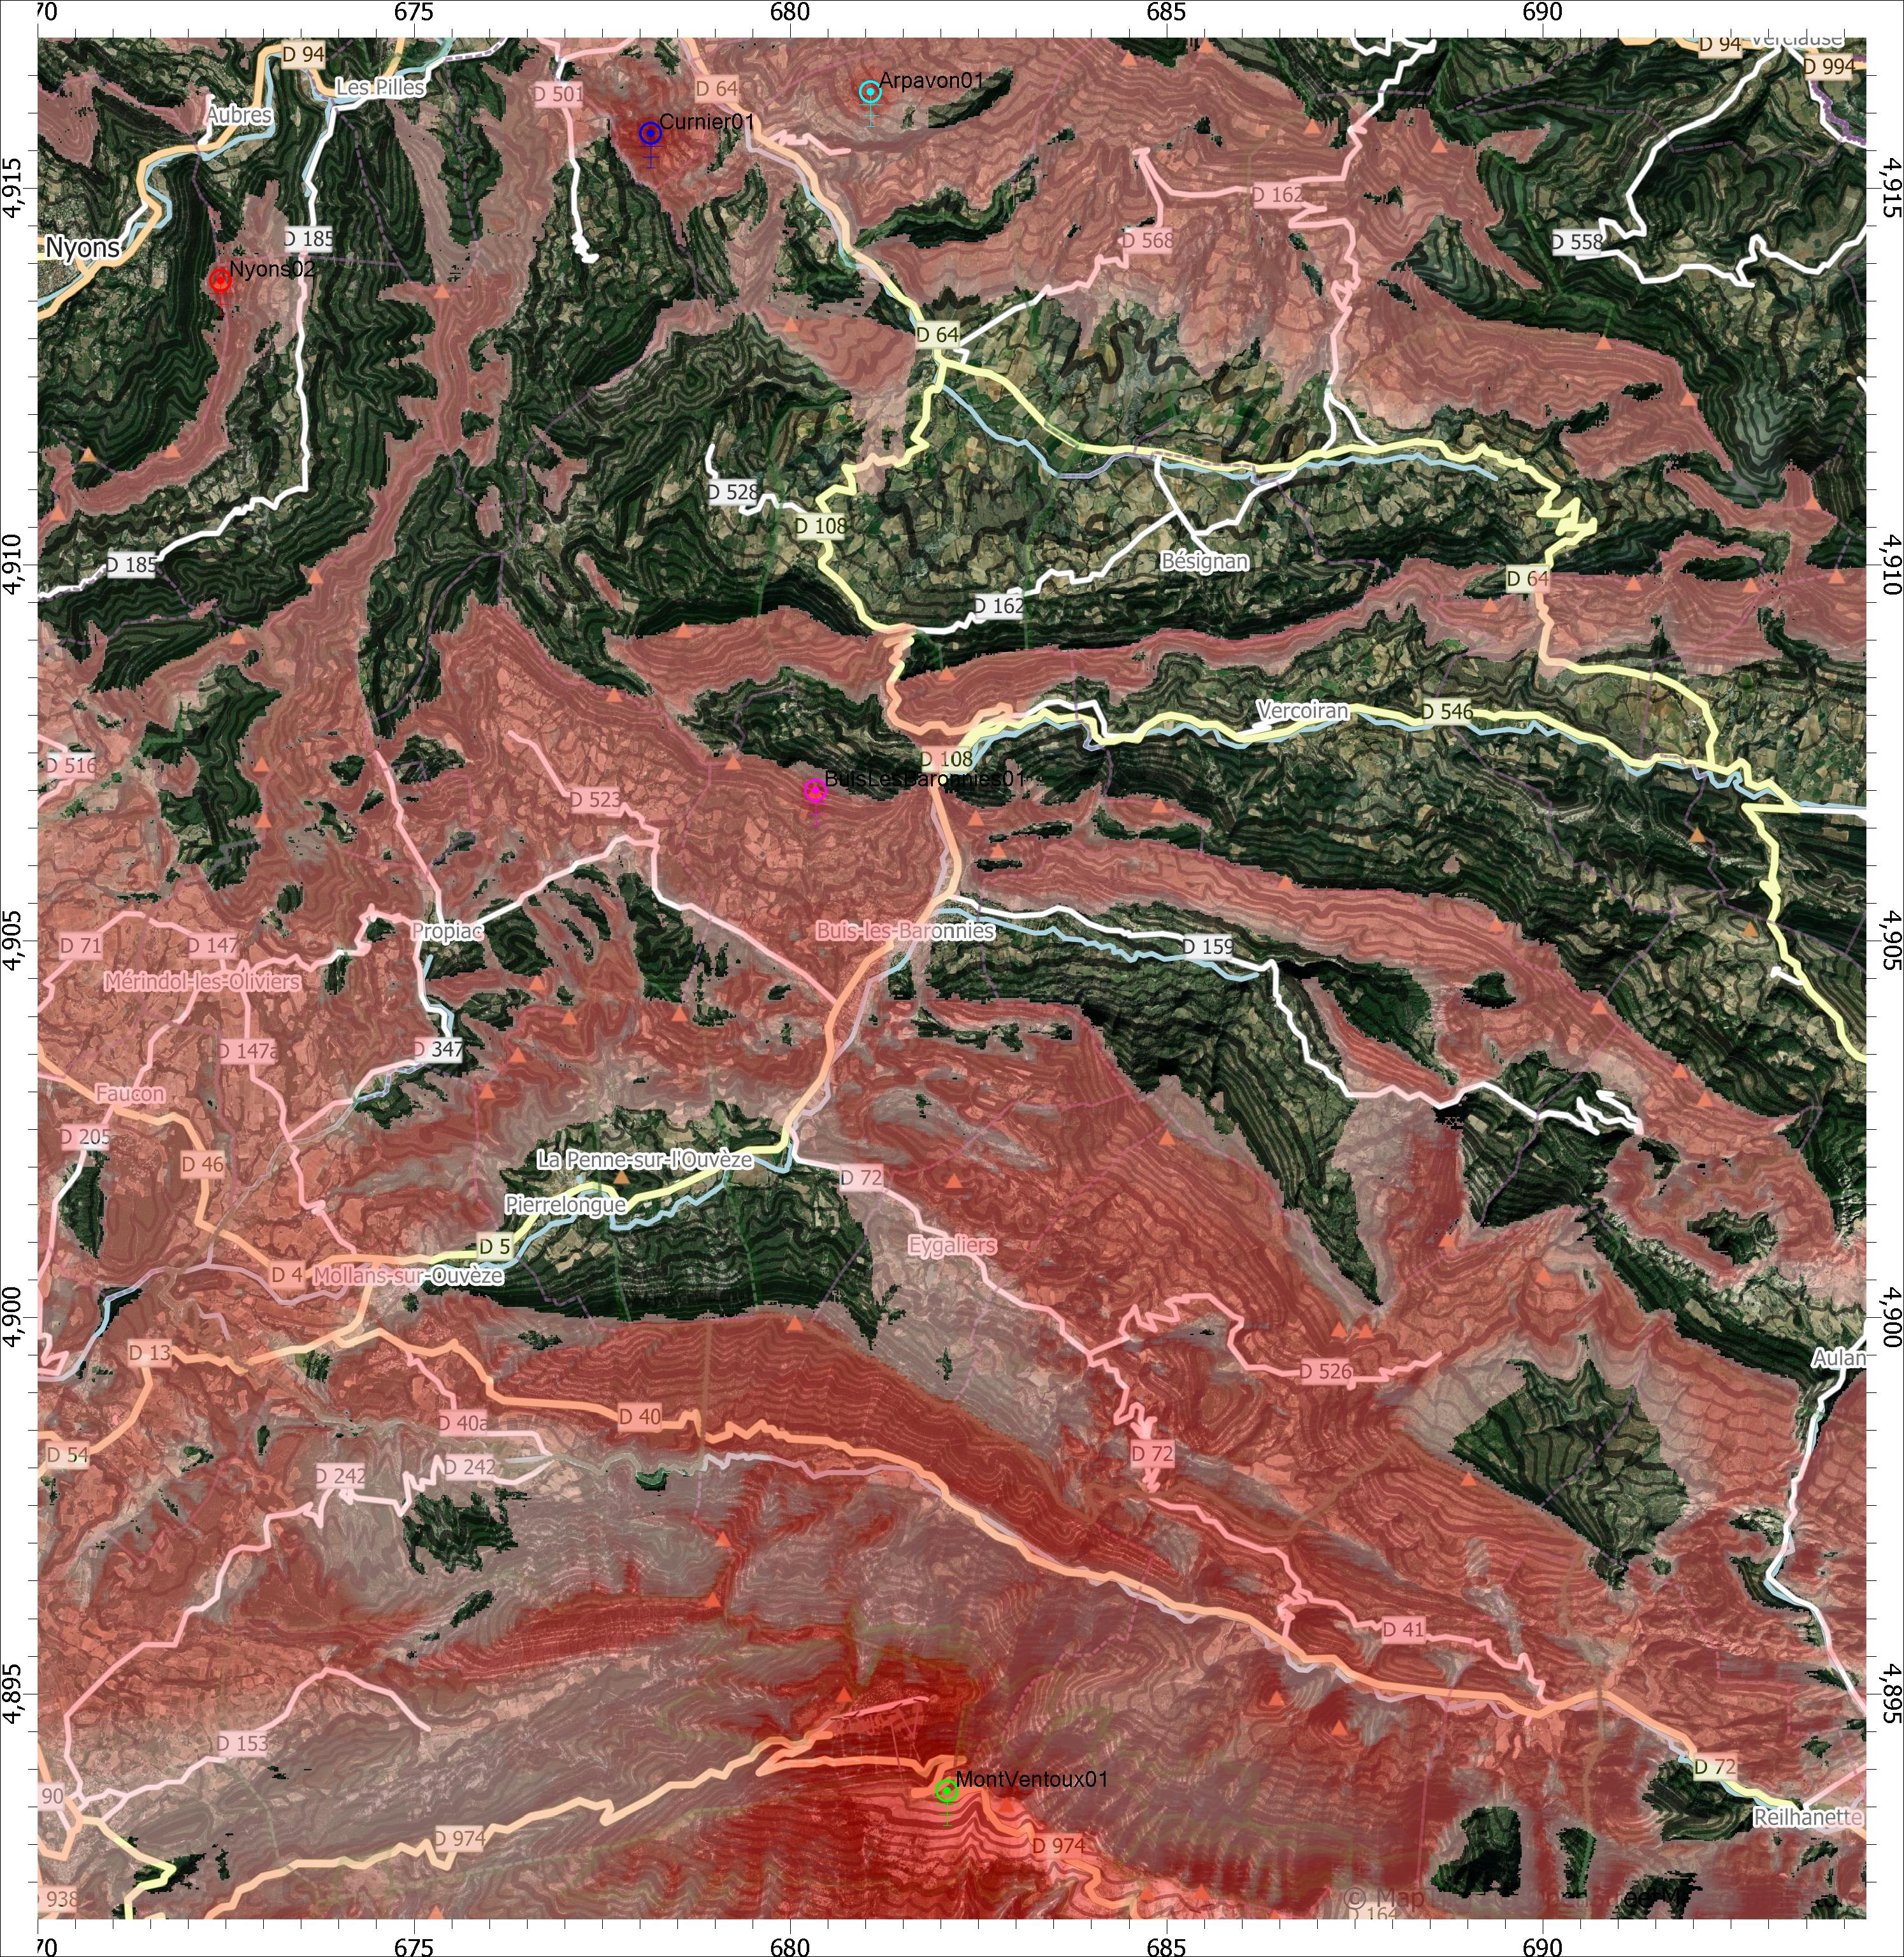
Atoll example
With map and height data generated by the previously described methods, the following quick draft of DVB-T digital television coverage simulation was performed on an area where reception is difficult. Transmitters positions come from ANFR Cartoradio1 and powers come from a forum 2,3. Of course, this quick draft must be refined, particularly concerning the radiation diagrams of some antennas. Nevertheless, the reception hole in the Ennuyé valley around Bésignan can be seen immediately due to the blocade of the Ventoux transmitter by the south mountain. The others transmitters are not significant on a wide scale because their are low power district transmitters.